108 Years of Goals, Goons & Goalies
At a Glance
- Vintage Hockey Series Recap
- About the Data
- Goals: Regressing to the Mean
- Where are all the Enforcers?
- Are Goalies Getting Better?
Vintage Hockey Series Recap
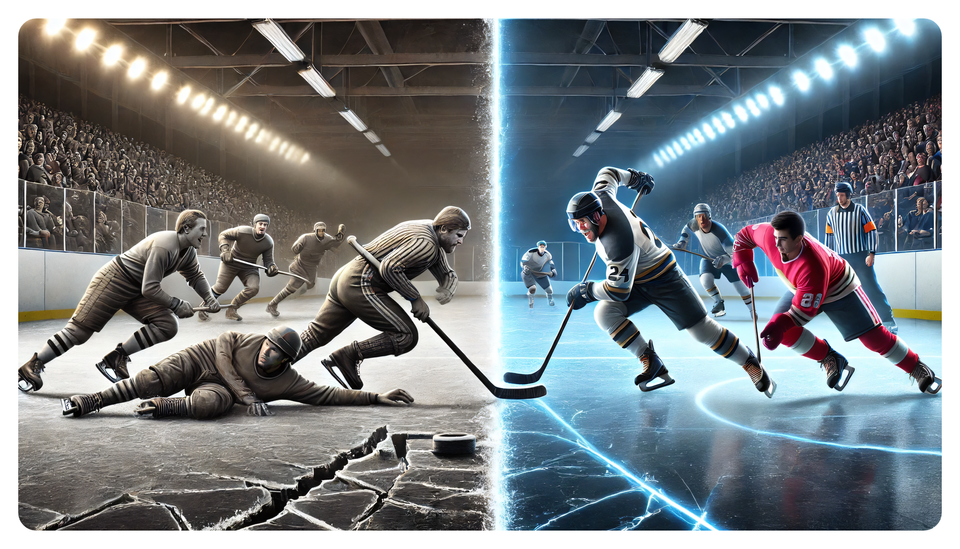
This is the second week in our newsletter series on Vintage Hockey: 108 Years of NHL & Hockey Analytics, where we explore how the game of hockey and the way in which we measure it has changed.
Our first week introduced the series and can be found here:
In this week's edition, we'll start digging into historical team data to explore trends and patterns across goal production, the evolution of the goon, and goaltending.
About the Data
We curated 108 years worth of team and player data for this Vintage Hockey series. This edition focuses on team data (sourced from Hockey-Reference), and includes all the available seasons (and leagues) worth of data. We combined, cleaned and transformed the 108 seasons worth of team data into a single dataset.
After you download the data, explore it to better understand what is included. At a high level, you will find the following:
- 114 rows of data, which equal 108 years worth of data with certain years (in the 1970s) including both NHL and WHA data.
- The dataset includes some metadata (e.g., SEASON, RANK, TEAM, etc.) with hockey statistics (e.g., Goals (G), Assists (A), etc.).
- Earlier years have fewer statistics than later years.
- We've added a column called TIME_PERIOD, which represents the five eras we outlined in our first newsletter in this series.
Note that we cleaned up the dataset in the following ways:
- We removed columns that only had NAs in them.
- We cleaned up the column headings and transformed the remaining NAs to zeros.
- We removed the "League Average" rows for each season and created a separate CSV that has the average statistics available for each season.
As you explore the data, you'll find some interesting trends in the data that indicate ways in which the game has evolved over the last 108 years. In this newsletter, we'll explore three areas: goals, goons and goaltending.
Goals: Regressing to the Mean
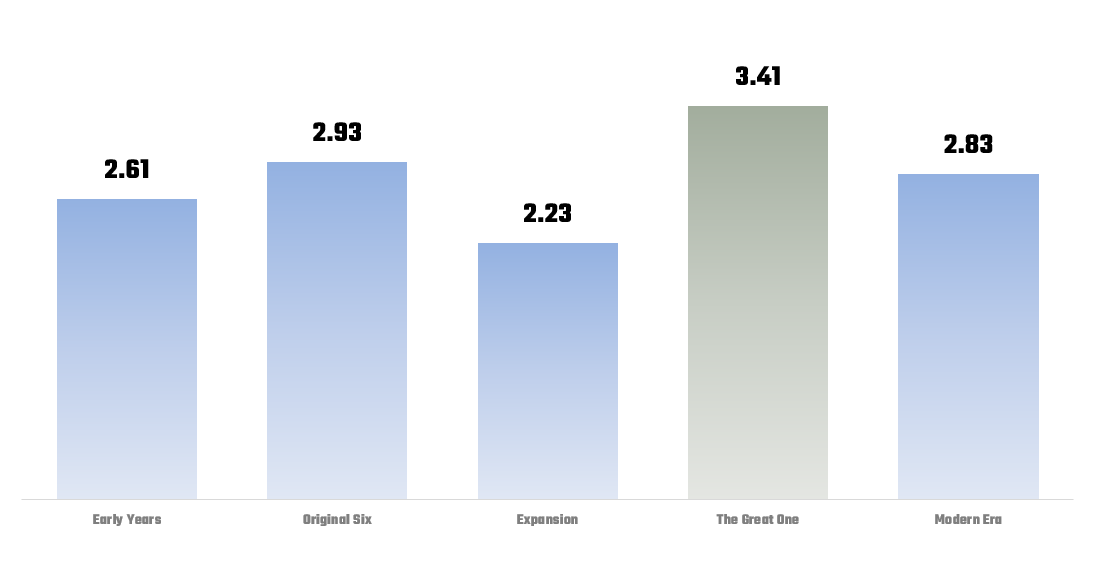
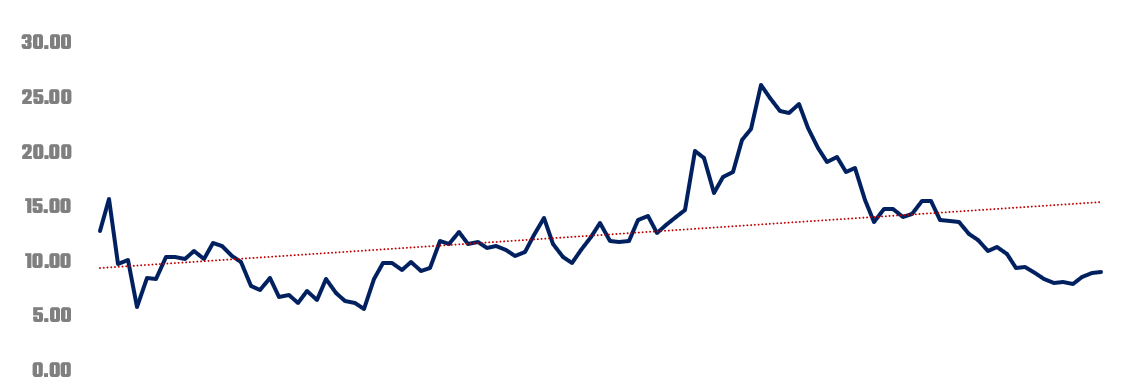
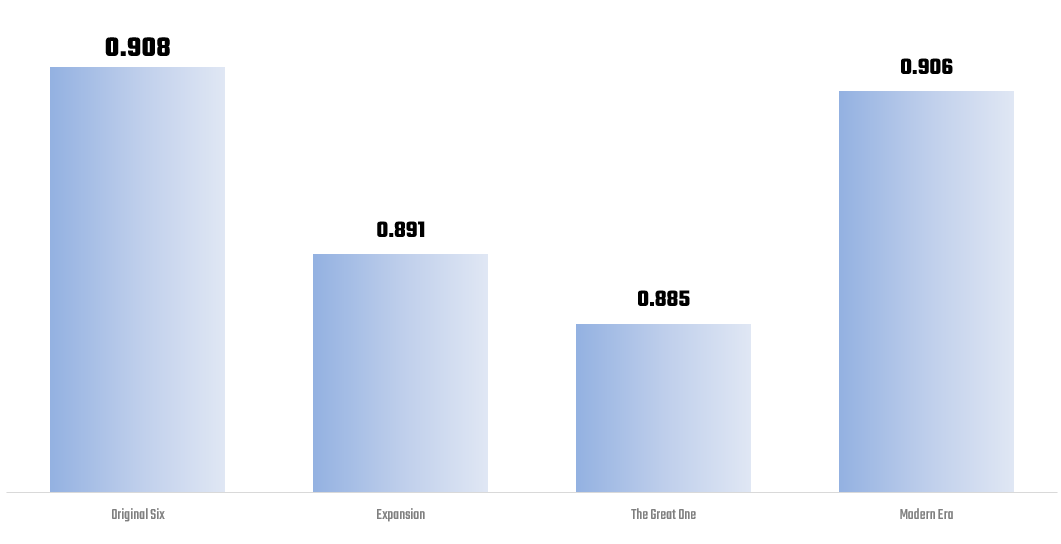
The average number of Goals per Game (or Average Goals) was up and down across the five eras but averaged between 2.23 and 3.41. The Great One showed a more significant difference at 3.41. However, this chart hides the season-level variability.
For example, the line chart below provides a granular view of Average Goals by season. Here, you can see more dramatic highs and lows early in the Early Years and Original Six and a steady increase in Average Goals during The Great One. The overall lifetime average is 3.02 Goals per Game – and interestingly has remained relatively flat.
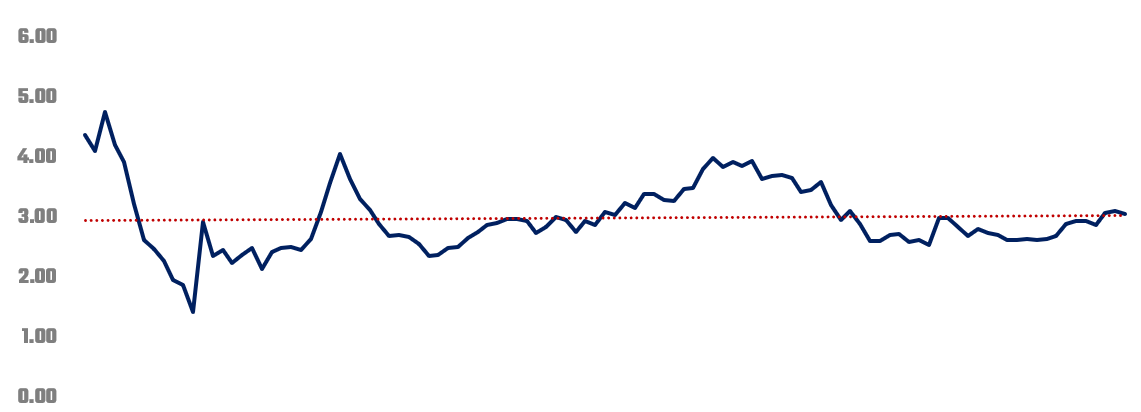
So, what's going on? Why the variability?
According to Sean McIndoe, author of The Down Goes Brown: History of the NHL:
[The] early games tended to be high-scoring. The league averaged just under ten goals per game in its first season. Part of that was due to the era’s goalies, who wore tiny pads and weren’t anywhere near as big or athletic as their modern counterparts. They also weren’t very skilled. Early scoring star Babe Dye’s signature move was simply to get a hard shot away quickly; that was enough to allow him to rack up repeated thirty-goal seasons and to regularly score from his own side of the red line against flustered goalies who hadn’t seen the puck coming (p. 6).
The game was definitely different back then. Here's an early photo from a game between the Montreal Canadiens and Toronto Maple Leafs. Of note here is the lack of protective helmets (for skaters and the goalie), the nature of their equipment and sticks, the state of the ice, the lack of protective barriers between the fans and the game, and more.
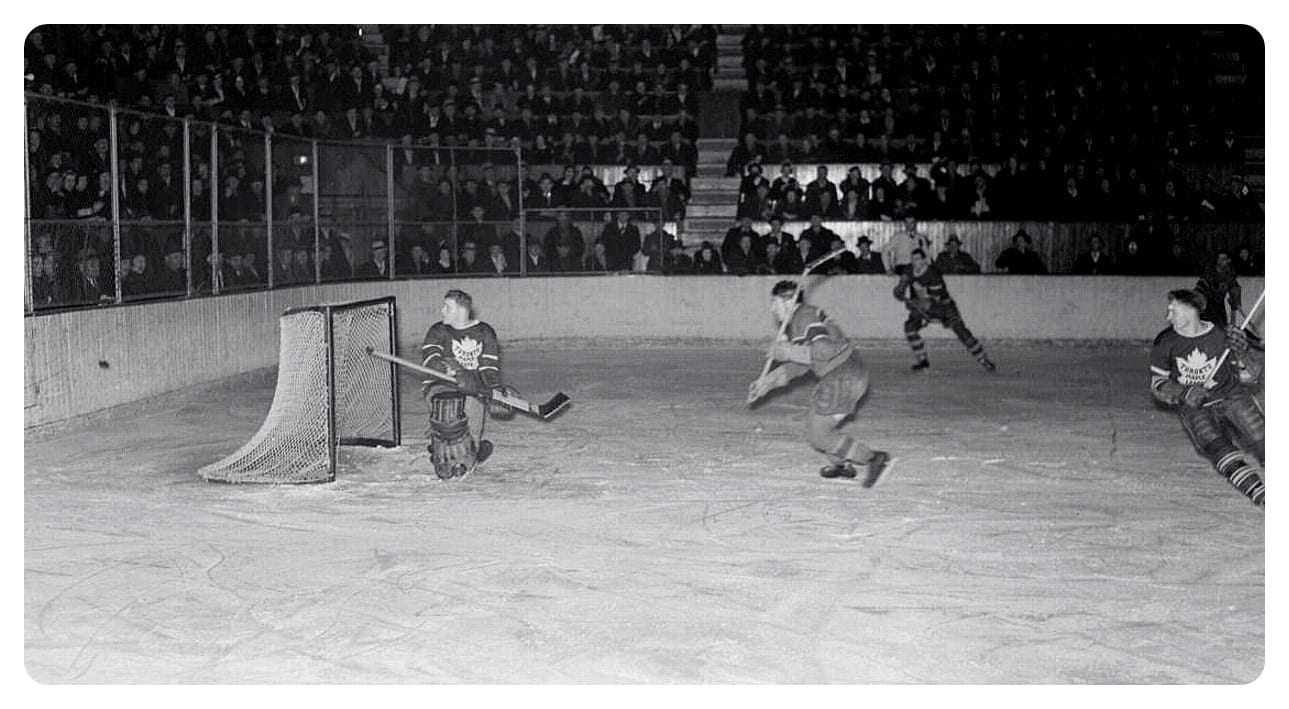
While the early state of goaltending accounted for some variability, other factors also impacted goal scoring, such as rule changes, expansion periods, improvements in player equipment and training, changes in playing style, and overall strategic evolution.
For example, below are examples of developments or events that impacted goal scoring.
- The early development of hockey as a professional sport.
- World War II impacted the talent pool, making teams less competitive and slowing down offensive output.
- League expansion introducing players with new styles of play and goal-scoring ability (e.g., Guy Lafleur and Bobby Orr).
- Offensive playing styles increased scoring averages – especially in the 80s with new superstars (e.g., Wayne Gretzky, Mario Lemieux, and Mike Bossy).
- Rule changes, such as the removal of the two-line pass rule, stricter penalties for obstruction, smaller goalie equipment, etc.
- A crackdown on slashing and other penalties, along with an emphasis on speed and offense.
The NHL continues to evolve, with scoring trends reflecting a balance between offense and defense.
Where are all the Enforcers?
Back in the day, enforcers (aka "goons") were a significant part of the game. They played an important part in the unwritten rules of hockey. If you measure the 'goon-ness' of the NHL through penalties, then The Great One was not just about Gretzky and a high goal-scoring era, but it was also the era of the enforcer. And the difference was significant: an average of 20.34 PIM per Game (or Average PIM)!
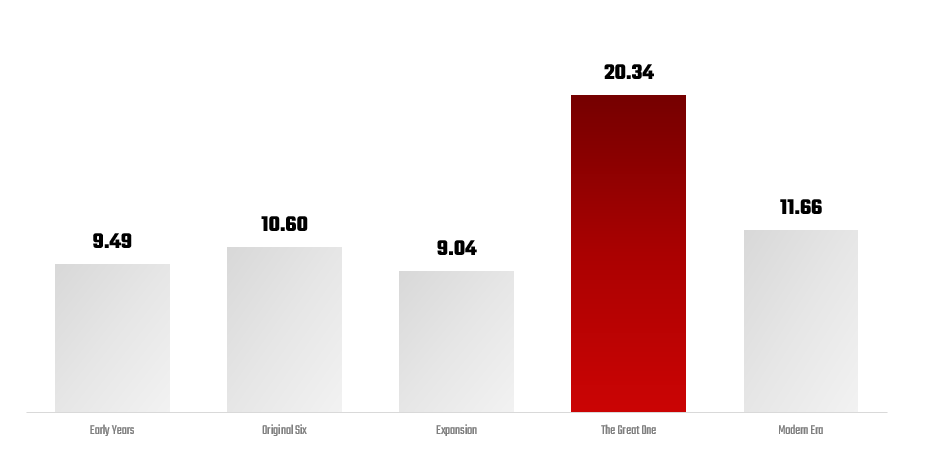
The overall average of Average PIM has increased throughout the NHL's history. Leading into The Great One as a high watermark era, the incidence of penalties were on the rise but have since decreased into the Modern Era.
Let's explore why this might have been.
The variation in Average PIM has been influenced by numerous factors, including rule changes, shifts in playing style, officiating, league expansion, and enforcement practices.
For example, below are a few developments/events that impacted the incidence of penalties and presence of enforcers.
- The Early Years were marked by a more physical, rough style of play, and the enforcement of rules was inconsistent.
- In the 1920s, the NHL standardized its rules, and there was a push to limit excessive violence, leading to fewer penalties.
- During World War II, many star players were enlisted in the military, and less experienced players filled in, which led to fewer games and a dip in penalty minutes.
- The game became more physical in the 50s, with aggressive checking, fights, and rough play becoming part of the game’s culture again.
- The NHL expansion introduced more rivalries and a greater focus on physical intimidation as teams sought to establish themselves.
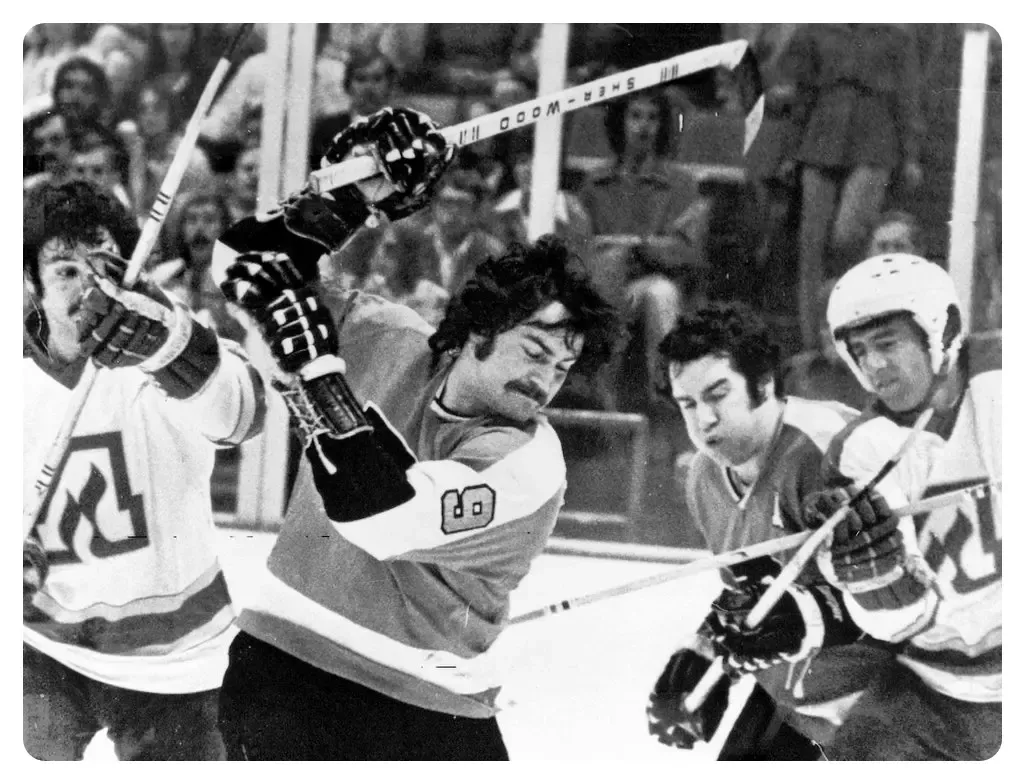
Further, specific periods in the NHL were marked with teams that were well known for being brutal enforcers. For example, in the mid 70s, penalty minutes had surged to over 14 minutes per game. The introduction of the Philadelphia Flyers' "Broad Street Bullies" style of play epitomized the era’s focus on physical dominance.
The 80s marked the peak of penalty minutes in NHL history, with the 1985-1986 season reaching an average of 21.42 PIM per game. This was driven by the fact that fighting was encouraged as a way to protect star players, enforcers were more common, toughness and physicality were more glorified, and high scoring games resulted in more aggressive, defensive play.
Since this time, rule changes such as the instigator rule, the neutral zone trap and the removal of the red line led to more power plays and a cleaner style of play, with PIM averages dropping to around 14 minutes by the mid-2000s. The evolution of play in the NHL has continued to evolve with a greater focus on speed, agility, and shooting.
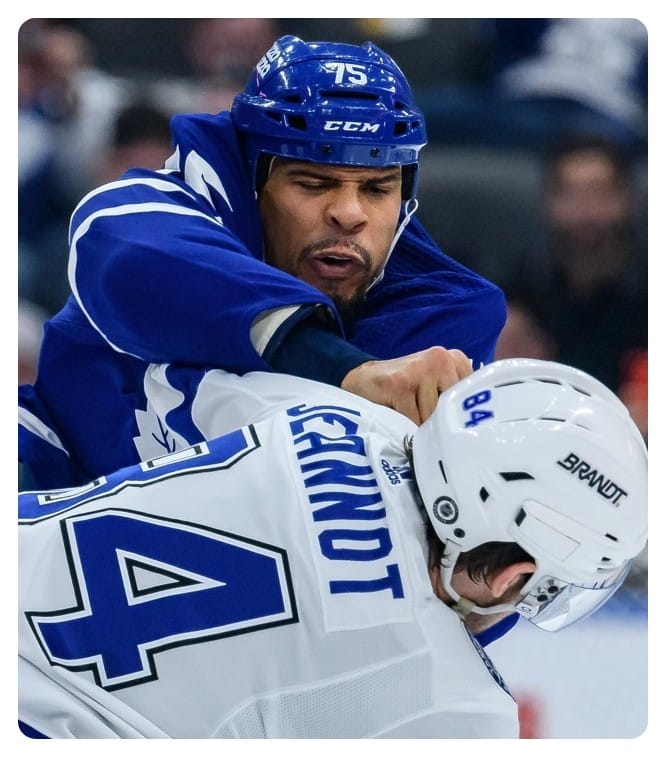
Although, with players like Ryan Reaves in the league, we're not about to claim enforcers have left the building.
Today, the NHL has significantly reduced penalties as fighting and physicality have become less central to the game, with player safety and skillful play taking precedence.
Are Goalies Getting Better?
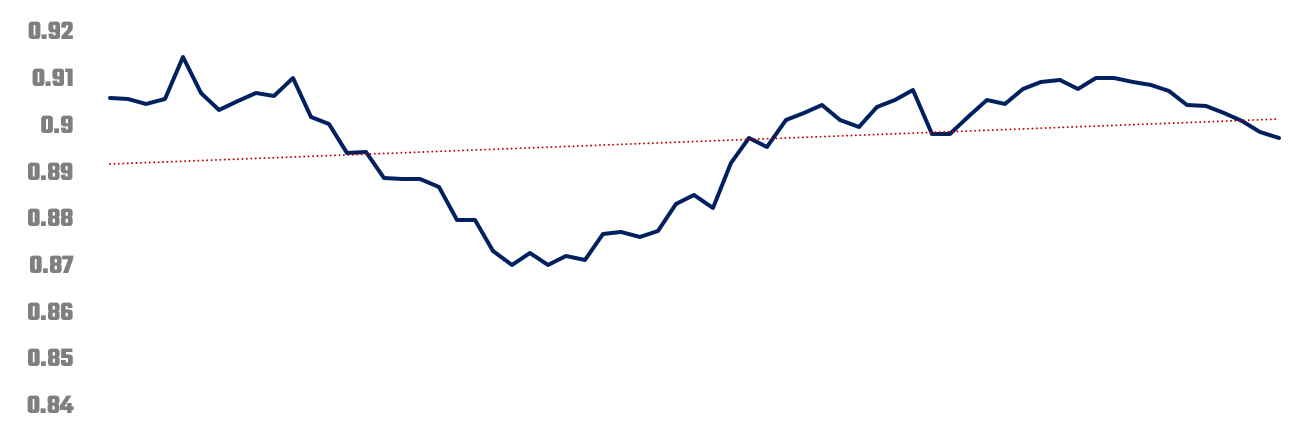
Save Percentage was collected when the NHL launched the Box Scores in the late 50s, so we don't have a complete view across all 108 years. However, we do have a view from the late 50s until now. Per the chart below, you can see the a steady decline and then an improvement in the Modern Era.
Dip notwithstanding, the overall trend line indicates that the quality of goaltending on average has increased across the life of the Save Percentage stat. Arguably, goaltending has come a long way from the early days.
So, what accounts for the shift in Save Percentage?
Below are a few developments/events that impacted goaltending.
- Goalie equipment advancements and better techniques have led to a higher Save Percentage.
- Defensive systems like the neutral zone trap, improved shot blocking, and more structured play have reduced the quality of scoring chances.
- Specialized goalie training, combined with advanced scouting, has helped goalies stop a higher percentage of shots.
- Increased shot volume but lower-quality chances have driven down shot percentage, as more shots come from less dangerous areas of the ice.
- Rule changes and the evolution of the game have further refined both offensive and defensive strategies, keeping this inverse relationship consistent over time.
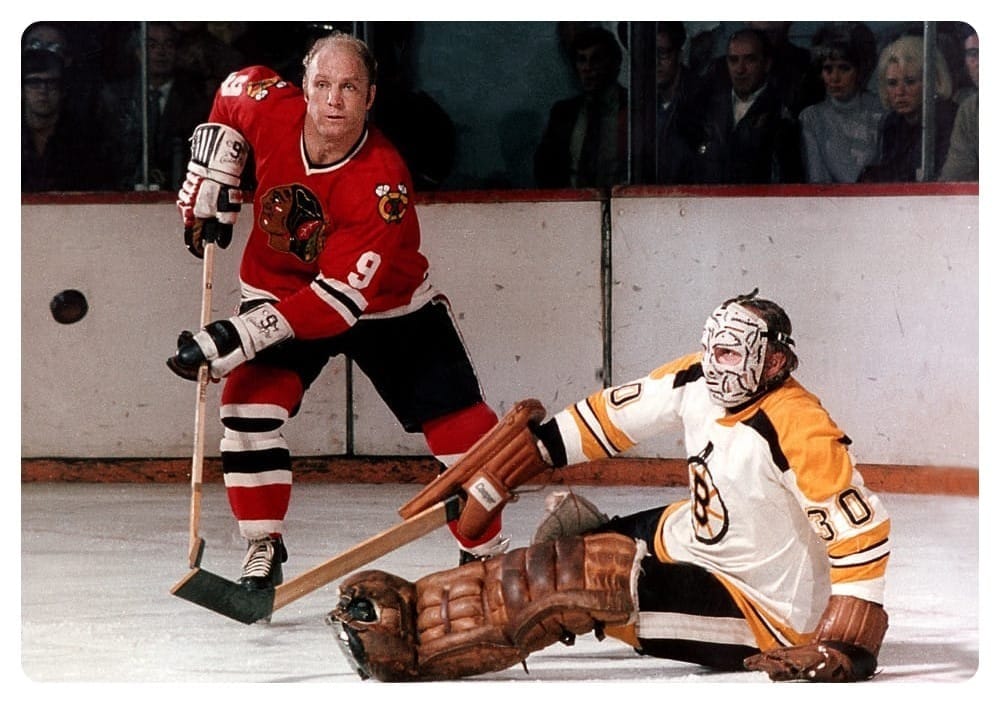
An example of the state of skater and goalie equipment in the 70s is shown below with Gerry Cheevers wearing an early goalie mask that he marked with a stitch mark for every puck he took to the face (during practice). Cheevers' equipment, compared to a modern NHL goalie, is starkly different.
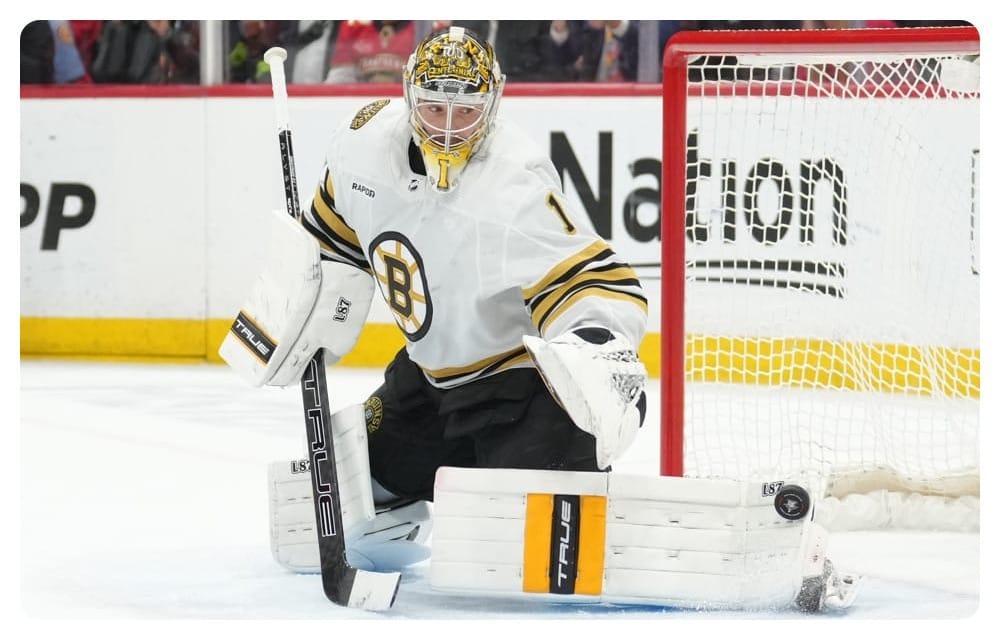
As a comparison, check out one of Cheevers' contemporaries, Jeremy Swayman, and you can see just how far goaltending equipment (and their style of play) has come.
All told, you can see that just evaluating three aspects of the game the data shows interesting changes along the way – from rule changes, maturity of sport, new playing styles and players, equipment changes, and so on. And it's not just about the game itself, but there is history around the game such as World War II that impacted the nature of how the game evolved.
Want to check out our quick-hit video on YouTube?
Summary
This was the second newsletter in our series entitled Vintage Hockey: 108 Years of NHL & Hockey Analytics, which explores the full history of the NHL. In this edition, we introduced you to the team statistics (collected from Hockey-Reference) and explored three aspects of the NHL history: goal scoring, goons and goaltending advances.
We discovered that each of the eras has some variability in how they evolved. For example, we found that lifetime Average Goals was 3.02 goals per game – there were significant spikes and dips across the 108 years for various reasons. We also found that the era for enforcers was the same as peak goal scoring, The Great One. And lastly, we saw that goaltending has improved since Save Percentage was collected. And while the early days of goaltending were more crude, much within the game and with goaltenders is leading to the highest level of goaltending on record.
If you want to download and conduct your own analyses, you can find the team statistics datasets below:
We encourage you to create your own analyses using these datasets for your own learning and practice, but please conform to Hockey-Reference terms of service beyond your learning.
Subscribe to our newsletter to get the latest and greatest content on all things hockey analytics!
Member discussion