4 Nations Face-Off: A Comparative Team Analysis
At a Glance
- Overview of the 4 Nations Face-Off Series
A multi-part series covering the 4 Nations Face-Off tournament - Summary View of All Teams
Offensive, Defensive & Goaltending Summary Statistics - Detailed Comparative Analysis
Explores Experience, Offense, Defense and Goaltending across all teams - This Week's Prediction
Updates our prediction based on new findings and analyses from this week
Overview of the 4 Nations Face-Off Series
This series explores the teams in the 4 Nations Face-Off tournament, with the end goal of predicting who will win the tournament. Our last newsletter focused on our final individual team analysis on Team USA: 4 Nations Face-Off: Can Team USA Take it All?
If you didn't get a chance to read it and want a quick catch-up, we've packaged it all up in a short video – and yes, with a bit of Northern bias.
In this week's edition, we'll conduct a comparative analysis at the summary and detailed level. The summary view uses two composite metrics for Offense and Defense, and we'll evaluate the summary stats for each of the goalies. And the detailed view is a Power BI dashboard with four reports: Production vs Age, Offensive Strength, Defensive Strength and Goaltending Strength.
Summary View of All Teams
In our previous newsletters, we aggregated summary statistics for each team across offense, goaltending and grit. This week, we updated our statistics and took another run at a slightly different set of statistics that cover offense, defense and goaltending.
For the Offense metric, we created a weighted, composite score between 0 and 1 that included Shots on Goal, Assists, Goals and Points. The statistics for this metric are self-explanatory; though, you could add others to broaden the dimensional coverage of the metric.
For the Defense metric, we created a weighted score between 0 and 1 that included Assists, Hits and Blocked Shots. We included these because defensemen typically have a higher average assist rate as compared to scoring goals. So, this metric not only covers physicality and the ability to block shots, but also to make plays up the ice.
The Goaltending metric is straightforward; it includes Goals Against Average (GAA) and Save Percentage.
Note that we also collected data for the last three years on the players in each roster, which now gives us a trend view.
Offense
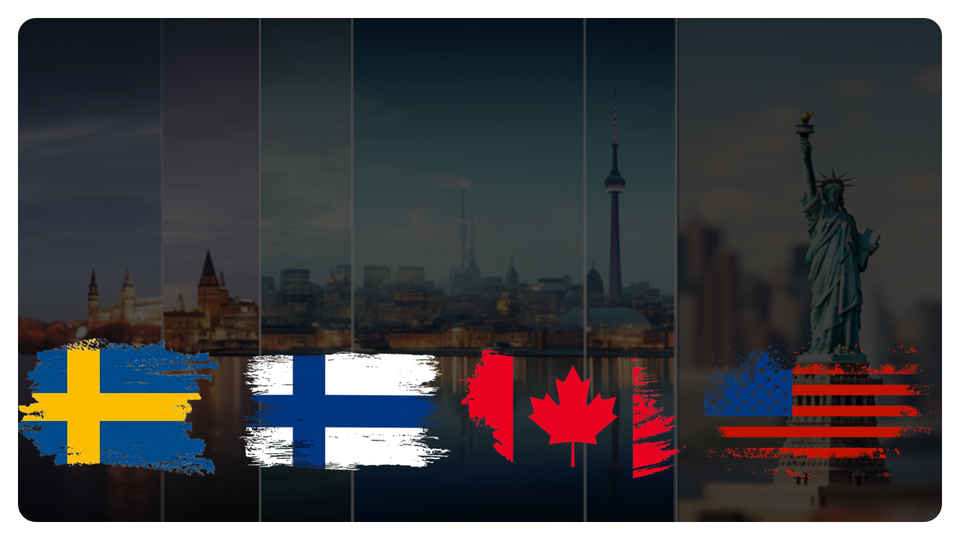
In the Offense metric, you can see that Canada came out on top with an average across the three seasons of 40.54%, followed closely by their strongest competitor in the tournament the USA at 39.97%. Canada leading in the offensive department has been a consistent theme across each newsletter. Likewise, Sweden and Finland trailing Canada and the USA has also been a consistent theme – which is echoed here.
While the three-year average between Canada and the USA is close, the current season average (roughly half complete) is wider by a small margin; that is, 31.85% for Canada and 30.40% for the USA.
And lastly, we still see two classes of offense here that will likely lead to two on-ice rivalries. This will make for interesting hockey for some games with potentially wider margins in other games.
Defense
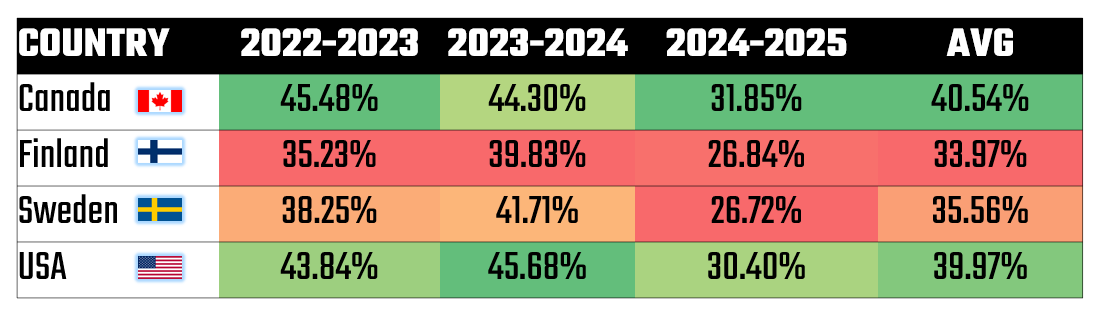
We previously amalgamated offense, goaltending and physicality into a single Overall Predictive Score (OPS); however, with a different mix of hockey statistics, we're now seeing a lower ranking for the USA. This is interesting because the Defense metric implies both the ability to be physical and block shots (typical defensive measures) and the ability to move the puck up the ice to the offensive line. Having the ability to defend and make plays means a tighter firewall on defense that can feed a strong offensive line.
So, here the race not only tightened between Canada and the USA, but moved Canada out in front by a modest margin – both for the three-year average and for the current season.
We'd also called out Finland as our spoiler team, but here we see the Defense metric puts them on their heels with all teams. So, while we're still voting for the underdog, this begins to show where the sleeper status could erode.
Goaltending
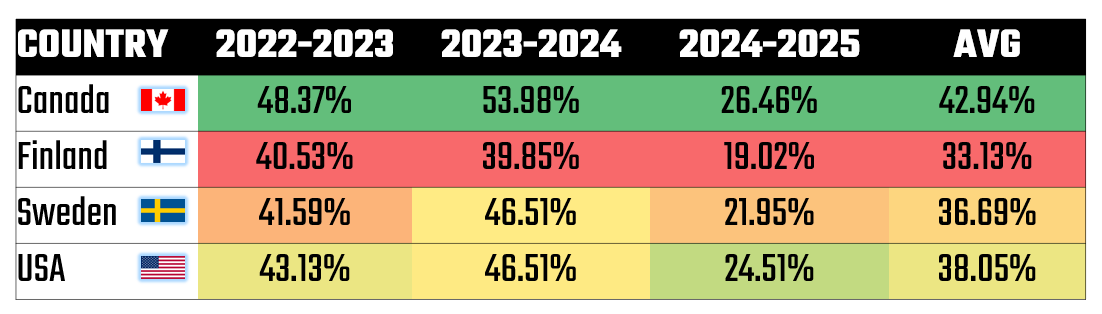
For goaltending, we focused more on this year's Save Percentage – using the average across all goalies to represent each country. Here, there's no real surprise from our past newsletters on the 4 Nations Face-Off. Overall, we see Sweden as the top-ranked team for goaltending and the USA coming in with one of the strongest goaltenders in Connor Hellebuyck.
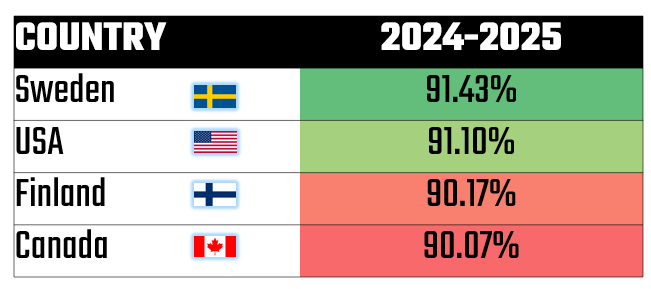
When you break out the goaltender statistics into a heatmap (across the the three seasons worth of data) and rank on the AVG SP (Average Save Percentage), you see Hellebuyck at the top of the ranking, along with other Swedish and American goaltenders that make up the top five. You also see how quickly you move from green to yellow and red with regard to AVG SP, reinforcing Sweden and USA as dominating in goaltending.
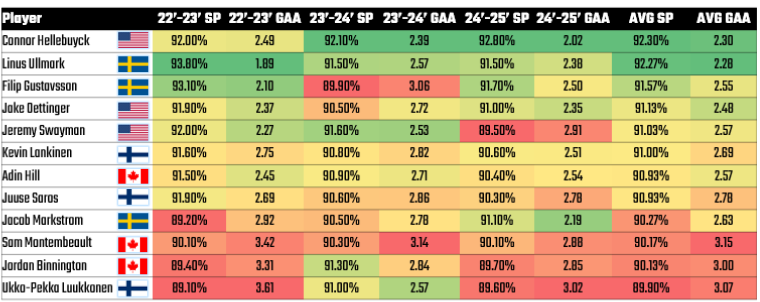
This is a bit of an eye chart, so we'll provide a better view for goaltending in the next section. In that view, you'll see more differentiation when we overlay other goalie stats on GAA and Save Percentage.
Detailed Comparative Analysis
Each week, we've been building Power BI dashboards to explore the individual teams. Each of the previous newsletters that focuses on a specific team has links to their respective Power BI dashboards. You can download this week's Power BI dashboard below, which analyzes all four teams together:
For this new dashboard, we updated the data and cross-compared all teams in one file containing four reports:
- Production vs Age– evaluates point production versus age/experience
- Offensive Strength – discovers the top offensive players using the Offense score and overlays Goals and Assists for more production context
- Defensive Strength – discovers the top defensive players using the Defense score and overlays Hits and Blocked Shots for more defensive context
- Goaltending Strength – presents the GAA and Save Percentage of all twelve goaltenders along with Quality Starts and Shots as overlays
Using these four reports, you begin to see the teams in a more side-by-side manner and we can better see stand-out players, potential goal-scorers or playmakers and defensemen who might more heavily influence the tournament.
Production vs Age
The Production vs Age report comprises two slicer controls (for Position and Season) and four scatter plots that help you visualize the relationship between Points and Age by individual player and team.
We also included an average line for Points and a trend line to represent the decay of production with age. And here's what we discovered (filtering for forwards only).
- The USA and Sweden have a steeper point-production decay with age. Canada is relatively neutral and Finland is slightly positive.
- Canada has the highest point-production average, followed by the USA, Sweden and then Finland. (Remember that this is filtered on the forwards and is a snapshot of mid-January stats.)
- Canada have a healthy cluster of forwards who are younger and can rack up the points. There appears to be more of a spread with the other teams, and with the USA and Sweden some age decay to that spread.
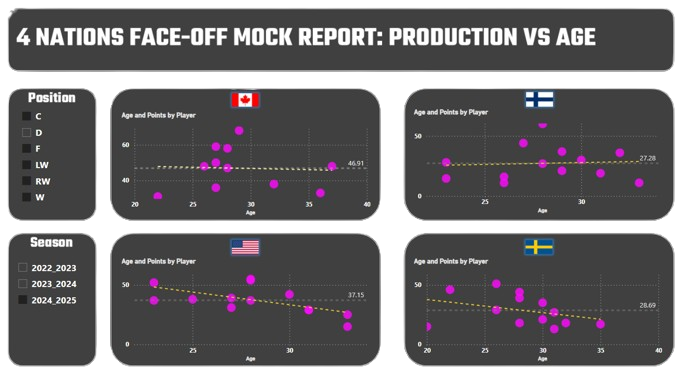
With these findings, we'd argue that Canada is still positioned to win the tournament if we only consider offense. That said, there can be strategy baked into the pairing of more experienced players (some of whom have Stanley Cup experience) with younger players – so we should be careful with taking too far of a leap on our conclusions here.
Offensive Strength
The Offensive Strength report has three slicer controls (Position, Country and Season), four cards (to display the average offense for a specific nation) and a single line and stacked column chart for the Offense score with some additional goals and assists for context. And here's what we discovered (filtering for forwards only and across all three seasons of data).
- Canada has the highest-rated Offense score at 43%, closely trailed by USA.
- Interestingly, Finland tops Sweden here by a very close margin.
- At the time of the data pull, the top five goal scorers are: 1) Auston Matthews (USA), 2) Mikko Rantanen (Finland), 3) Connor McDavid (Canada), 4) Nathan MacKinnon (Canada), and 5) Adrian Kempe (Sweden). McDavid and MacKinnon also have the highest playmaking (by Assists) in this top-five cohort.
- When filtering on the current season and ranking by Offense score, we see a slightly different top five: 1) Jack Eichel (USA), 2) Nathan MacKinnon (Canada), 3) Adrian Kempe (Sweden), 4) Brandon Hagel (Canada), and 5) Anthony Cirelli (Canada). This top-five cohort is dominated by Canada.
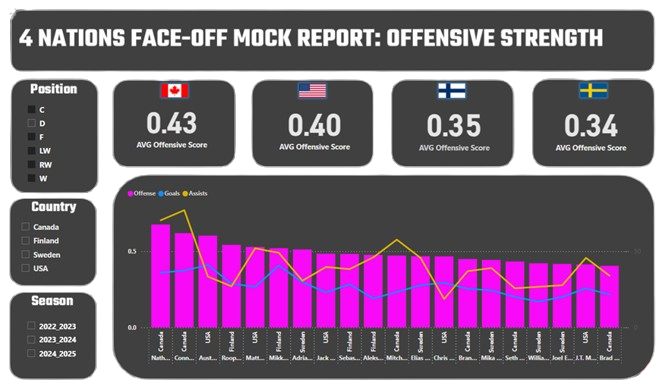
In sum, most of the offensive signal points to a dominant Canadian team.
Defensive Strength
The Defensive Strength report has three slicer controls (Position, Country and Season), four cards (to display the average offense for a specific nation) and a single line and stacked column chart for the Offense score with some additional goals and assists for context. And here's what we discovered (filtering for defensemen only and across all three seasons of data).
- Canada has the strongest Defense score by a significant margin (for the three seasons). However, when filtering on the most current season, Canada is still leading, but by a smaller margin (36% Canada, 31% USA, 30% Sweden and 23% Finland).
- The top five defensemen (again, filtering for the current season) are 1) Cale Makar (Canada), 2) Josh Morrissey (Canada), 3) Esa Lindell (Finland), 4) Zach Werenski (USA) and 5) Alex Pietrangelo (Canada). Here, again we see a more dominant Canadian defensive line-up.
- When you sort on Blocks, you see a slightly different picture: Finland and USA are more dominant in the top five. When you sort on Hits, it's a mixed bag across Sweden, Canada and Finland in the top five.
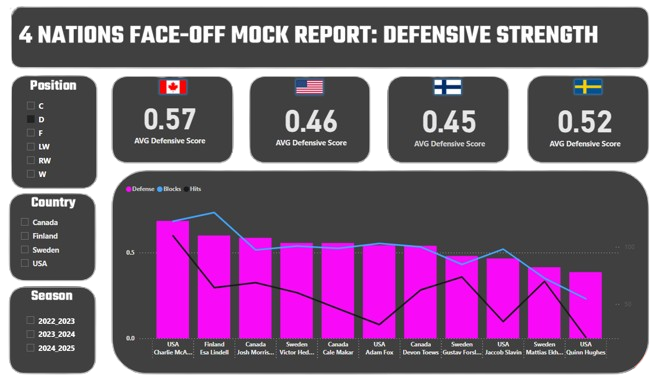
Here again, if we're to use the Defense score as our key signal, Canada is out in front. Though, on the statistics that substantiate the Defense score, we see other teams factor in. This tells us that Canada has a strong defensive line, but their break-out and headman capabilities that could be a differentiator.
Goaltending Strength
The Goaltending Strength report has two slicer controls (Country and Season), and two line and stacked column charts for GAA and Save Percentage. We've also added Quality Starts and Shots for a bit of context on these core goalie stats. And here's what we discovered ( across all three seasons of data).
- Sweden and the USA compete for the top-ranked goaltending spots.
- Linus Ullmark and Connor Hellebuyck are stand-outs. Given Hellebuyck's stats (significantly higher Quality Starts than other goalies and the highest (tied with Juuse Saros) number of Shots.
- When filtering for this season only, Connor Hellebuyck has the best GAA and Save Percentage and significantly higher Quality Starts and Shots than the other goalies. He will be a difference-maker for the USA.
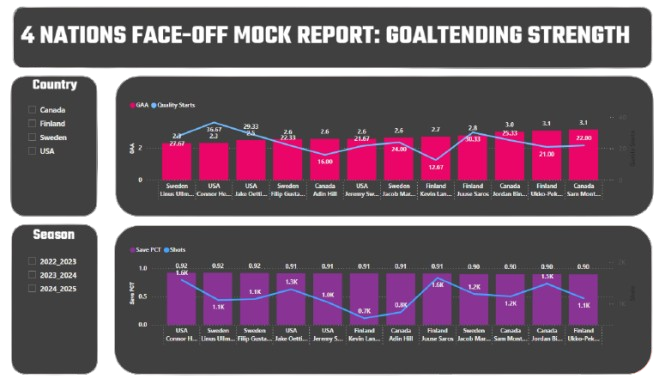
While we've been seeing signal on Sweden and the USA having the best goaltending in our individual team analyses, the additional information we discovered this week is the significant difference between goalies (e.g., Connor Hellebuyck) when overlaying Quality Starts and Shots. The additional context helps substantiate the core goalie stats.
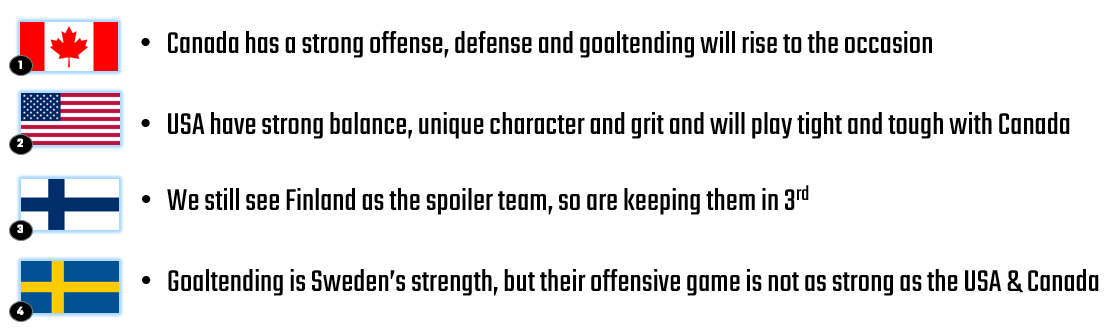
This Week's Prediction
This is our sixth newsletter on the 4 Nations Face-Off, and for the most part we've been consistent – save for a bit of bounciness. This week, we'll close our exploratory analyses of each of the teams and in this week a comparative view with the following prediction:
In our final newsletter next week, we'll build a predictive model to see how that model stacks up against our findings across the last few weeks.
Summary
In this week's newsletter, we brought our exploratory analyses for the teams to a close and did a summary and detailed comparative analysis (across three years worth of data). For the summary analysis, we created Offense and Defense composite metrics to help measure and compare the teams. We also leveraged Save Percentage to compare the goalies.
We built the detailed comparative analysis in Power BI, which you can download from here. Feel free to explore and leverage this dashboard for your own learning and projects.
In our final 4 Nations Face-Off newsletter, we'll build a predictive model to see if that forecast contradicts (and gives us more information) than our individual and comparative team analyses.
Subscribe to our newsletter to get the latest and greatest content on all things hockey analytics!
Member discussion