Early Predictions for the 4 Nations Face-Off
At a Glance
- Introducing the 4 Nations Face-Off Series
A multi-part series covering the 4 Nations Face-Off tournament - What is the 4 Nations Face-Off Tournament?
An international tournament including Canada, USA, Sweden and Finland - The Strength of the 4 Nations Face-Off Teams
Explores which nation is the strongest through various analyses - Too Early to Predict?
Is there enough data to predict who could win?
Introducing the 4 Nations Face-Off Series
Instead of the normal All-Star festivities, next year the NHL is hosting the 4 Nations Face-Off, an international tournament featuring four countries playing off against one another comprising only of NHL players.
To prepare for the tournament, we're going to analyze different aspects of the tournament with the end goal of predicting who will come out on top. To do this, we'll publish a series of newsletters covering the following:
- Analyzing the strength of each nation's team
- Deep dive on each nation's team to understand strength and weakness
- Build a predictive model to forecast who will win the tournament
In keeping with our theme here on DPH, we'll focus on the analytics to see what story emerges.
What is the 4 Nations Face-Off Tournament?
The 2025 NHL 4 Nations Face-Off is an international tournament scheduled from February 12th to 20th, 2025, in Montreal, Canada, and Boston, USA. This event will temporarily replace the NHL's annual All-Star Game for the 2024–25 season.
The four teams that make up the tournament are Canada, Finland, Sweden and the USA. The tournament format is round-robin, so each team will play against every other team once, totaling three games per team. The point system is 3 points for a regulation win, 2 points for an overtime or shootout win, 1 point for an overtime or shootout loss and 0 points for a regulation loss. The two teams with the highest points will compete in a one-game final to determine the champion.
The tournament will be hosted at the Bell Centre in Montreal and TD Garden in Boston. The schedule for the tournament is as follows:
- February 12: Canada vs. Sweden
- February 13: United States vs. Finland
- February 15: Finland vs. Sweden; USA vs. Canada
- February 17: Canada vs. Finland
- February 18: Sweden vs. USA
- February 20: Championship Game between the top two teams
Now that we've got the basics out of the way, there's a ton of discussion online about the different rosters, who was (and wasn't) chosen and why, and which country will win the tournament. Throughout our series, we're going to skate down the rabbit hole and explore three different dimensions (country, team and player) to predict who we think will win the tourney.
If you don't feel like reading right now, can check out our quick-hit video below and come back to the newsletter later on!
The Strength of the 4 Nations Face-Off Teams
Our first analysis is to understand at a high level the relative strength of each of the nations. We'll look at strength from three perspectives:
- The available pool of players in the NHL (based on nationality)
- The teams from which the players are being drawn
- The strength of the teams by country
Available Pool of NHL Players
The NHL players are the source for the four countries; however, the size of the pool is different for each country. For example, the chart below shows 1) the total players from each country playing in the NHL, 2) the average points for the pool of players, and 3) the relative percentage for each country as compared to the broader NHL.
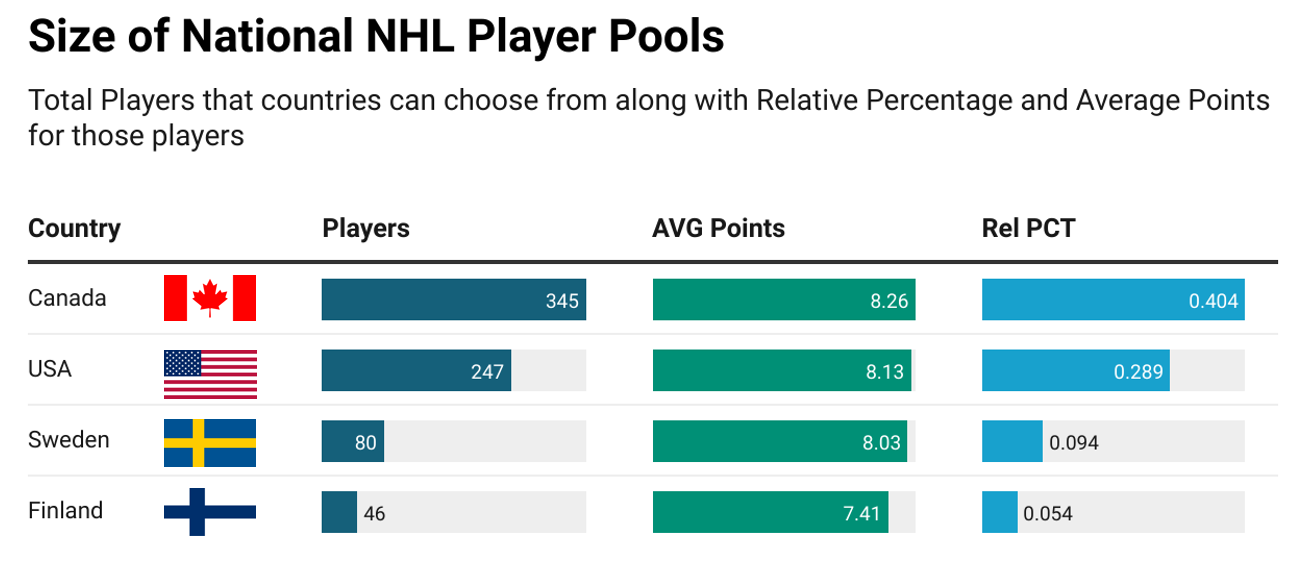
Canada has an advantage by representing 40.4% of the league from which they can draw players. USA comes in second, representing 28.9%. Sweden and Finland have a tougher go of it with smaller pools to choose from – 9.4% and 5.4% respectively. Note that average points correlate to the relative percentage of available players, increasing as the relative pool of players per country is larger – Finland coming in at the lowest with 7.41 points.
Being able to draw from 345 players versus 46 players can significantly influence a team's strength in this tournament. Canada and the USA have the largest pools, giving them more players to select from and increasing the likelihood of fielding elite talent. Meanwhile, Sweden and Finland, with smaller pools, have to rely on higher efficiencies in their rosters (coupled with a deeper grinder factor).
Which Teams are Sourcing Players
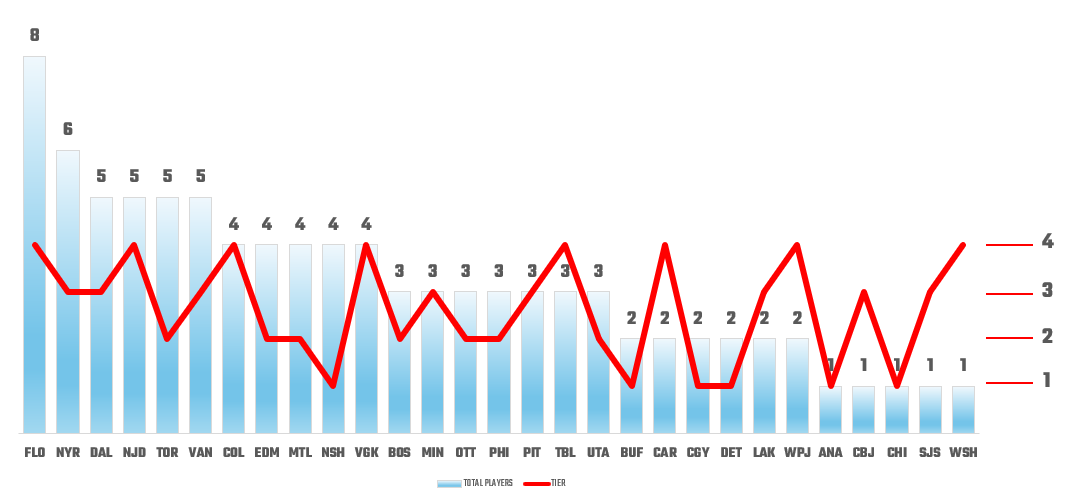
This next chart highlights the NHL teams that are contributing players to the 4 Nations Face-Off (columns) versus their point-production quartile (line).
It highlights the distribution of players across teams, giving insight into which franchises are providing the largest contingent of players for the tournament. In short, we can see how many players are coming from higher-ranked teams. For example, the Florida Panthers are in the top quartile (4) as a point-producing team and are also contributing the most players to the tournament.
So, what does this tell us?
The chart tells us where the tournament is sourcing its players and the categorized strength of that team based on their point production. So, you can see that the top contributor is the Florida Panthers (FLO), who lead with 8 players, making them the single largest provider of talent for the tournament and the second highest is the New York Rangers (NYR), who are contributing 6 players. You can trace how other teams contribute along with their point-production strength.
However, you can also see where there are lower players represented in the tournament from teams that have a higher point-production rating. For example, Carolina Hurricanes and Winnipeg Jets are at a 4, but only have 2 players in the tournament. Washington Capitols are also at a 4 and are only contributing 1 player.
The Strength of Teams by Country
The above analyses are more general and don't show how strong the countries are in and of themselves. So, to evaluate each country, we used the rosters for each of the participating countries and analyzed (using averages and totals per player) key statistics ranking from point production to penalties to goaltending.
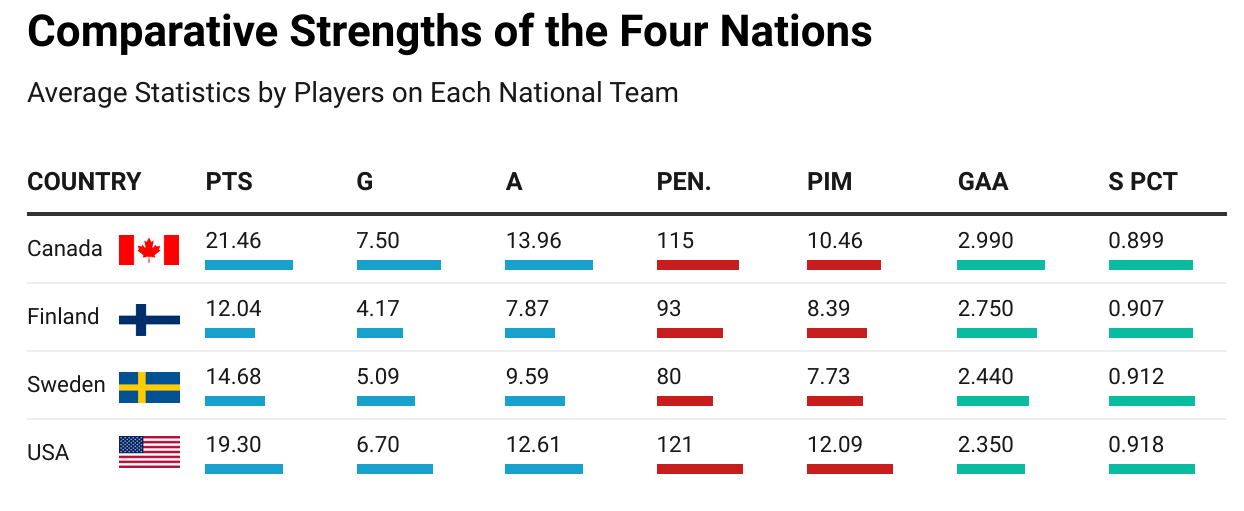
This view is interesting because no one team dominates in any specific area. For example:
- Canada are strong on offence as evidenced by their points. But, they're the weakest on goaltending and higher on penalties, which can work for or against them.
- The USA are likewise strong on offense with the second-highest numbers, but also are strong in-between the pipes and are the grittiest by virtue of their penalty stats. So, all told, a well-rounded team statistically.
- The Fins and and the Swedes come in lower on offense, are in the middle of the pack for goaltending and are less gritty.
The above chart tells us quite a bit (at the summary level), but if we deep dive on one area, point production, we get a bit more substance in the story. To do this, we plotted point production using a density plot, which visualizes a distribution of the points for players participating in the tournament.
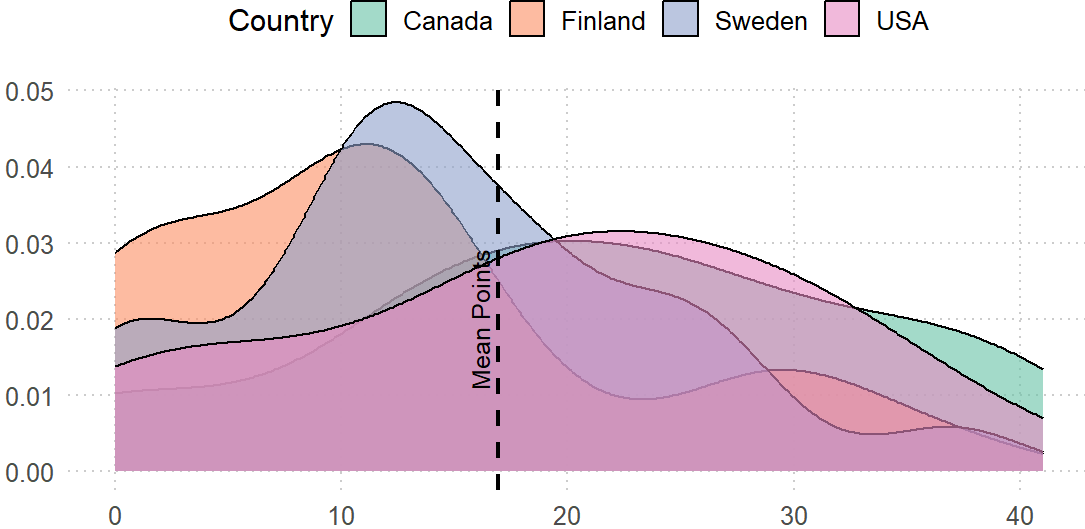
It reinforces the strong Canadian and American offense (they have consistent concentrations of players above the mean), but it also gives you more context on Finland and Sweden. That is, Finland and Sweden have a higher concentration of point production below the mean with higher density. This translates into a higher number of middle-of-the-road point-production players that are going up against a bigger pool of higher point-producing players in Canada and the USA.
Too Early to Predict?
Short answer: yes. However, based on the above summary data, we'll offer an initial gut feel. We'll first summarize our findings and then provide an early prediction.
Initial Summary
Based on the above data and analyses, our findings are:
- Canada has the largest player pool with strong overall offensive production (points, goals, assists). They also have a balanced contribution from forwards and defensemen. Canada's goaltending is reliable but may not dominate compared to Sweden and Finland. They're also gritty as measured through penalties; however, this can play for and against them.
- USA has slightly lower offensive averages compared to Canada, but is still strong overall. They have high consistency across player contributions and are also a physical team. And they have reliable goaltending, second only to Sweden.
- Sweden has strong defensive players and goaltending. However, they have lower offensive contributions compared to Canada and the USA. They are also a less gritty team, so could get knocked off the puck – putting their defensive play at a disadvantage.
- Finland has the smallest player pool, but high-impact players. They also have weaker overall defensive metrics, with a higher GAA. And they have a high reliance on key individuals rather than depth.
An Early Prediction
If we were forced to call it today based on the above analysis, here's how we would rank the teams coming out of the tournament. Let's start with last place and go to first.
- Finland: We love Finland, but it would be a stretch for them to win this tournament. Based on the above, they're weaker offensively and between the pipes. We may see an upset with Sweden, but we also see them coming in fourth place.
- Sweden: Sweden is also weaker offensively and mediocre (as compared to the other teams) between the pipes. It will be close, but they will likely beat Finland but not Canada or the USA.
- USA: The Americans are strong offensively and have grit and solid goaltending. If this tournament is anything like the playoffs, goaltending will be key. However, Canada has a star-studded line-up, so while the USA are better in the net, they will also face a fierce offense from the likes of Canada.
- Canada: They're strong on offense, balanced on defense, high on gritty hockey, but comparatively weaker between the pipes. That said, the intangibles of pride here are an edge factor (yeah, there's that whole "51st state" thing that is perfect to play out on the ice). So, we believe Canada will win the tournament. But, it's going to be close – really close. We believe you will see two epic games between the USA and Canada, on 02/15 and 02/20 (our forecast), and they will be tough, close and amazing to watch.
Now, we don't recommend you go bet the farm; we provide the above for educational and entertainment purposes only. And there's still a lot of hockey to go and there could be more changes to each of the teams. But, caveats aside, we'll continue to break down the teams and match-ups in this newsletter series and build more accurate predictive models as we go to see what the math says. We'll also get you the data we're using, so you can build your own models.
Summary
This was the first newsletter in a new series where we'll focus on the upcoming 4 Nations Face-Off, an international tournament happening in mid February, 2025.
In this newsletter, we gave you the basics of the tournament and analyzed our data to understand where the four teams are sourcing their players from, where each country is strong or weak and how the teams compare from a point production perspective.
We closed this week by providing an early prediction that Canada would win the tournament – based on the perfunctory analyses we did. Over the next few weeks, we'll go deeper with each team and then in our final newsletter run a couple of predictive models that will hopefully give you a tighter view on who will take the tournament.
Subscribe to our newsletter to get the latest and greatest content on all things hockey analytics!
Member discussion