A Tale of Two Eras: Gretzky vs McDavid
At a Glance
- Vintage Hockey Series Recap
- About the Data
- The 80s Versus Today
- Contrasting Gretzky and McDavid
Vintage Hockey Series Recap
This is the third week in our newsletter series on Vintage Hockey: 108 Years of NHL & Hockey Analytics, where we explore how the game of hockey (and the way in which we measure it) has changed.
The first two weeks in the series can be found here:
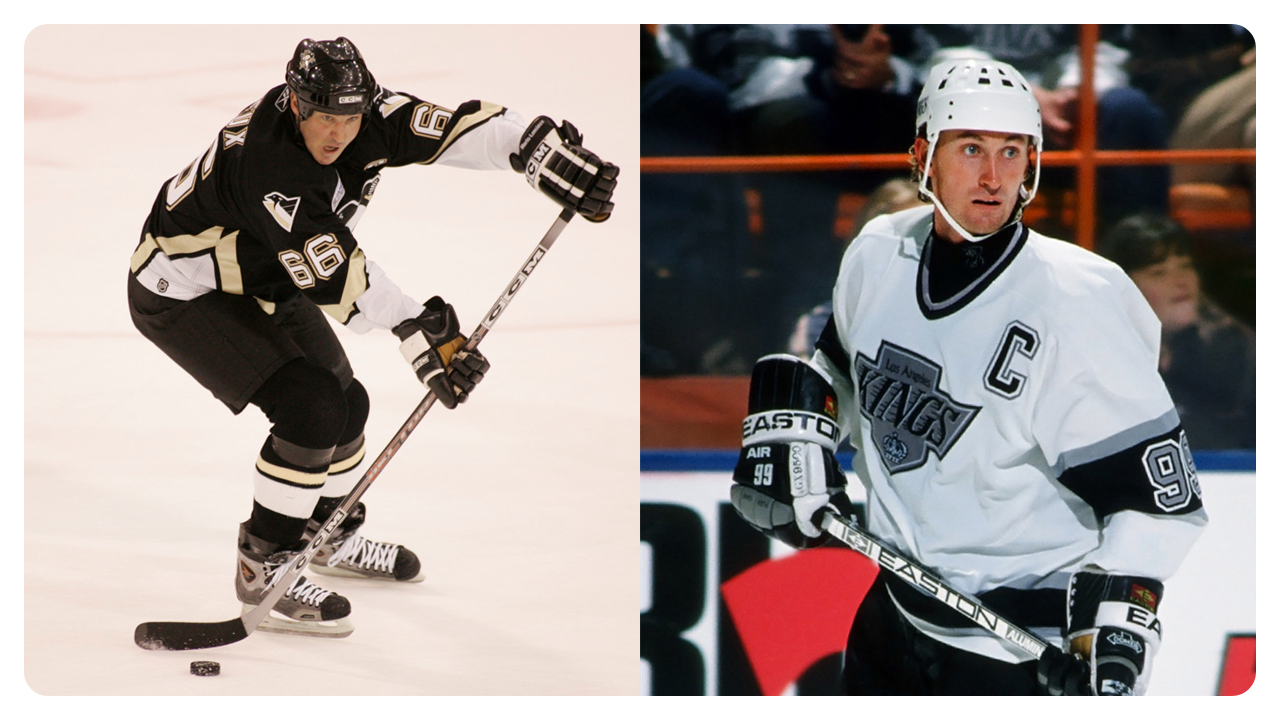
In this week's edition, we'll zoom in and compare two eras, the 80s versus today (or The Great One versus the Modern Era), through two players:
Wayne Gretzky Connor McDavidArguably, these guys are two elite players from different eras, so we're excited to see what we find.
If you missed last week's newsletter and are shy on time, you can catch up with our quick-hit video below.
About the Data
We curated 108 years worth of team and player data for this Vintage Hockey series (sourced from Hockey-Reference). This edition focuses on Gretzky's and McDavid's player statistics, which we derived from the full player dataset from 1917 to 2024.
After you download the data, be sure to explore it to better understand what is included – there's lots there to explore. At a high level, you will find the following:
- A row of data for each player who played in each season from 1917 to 2024.
- The dataset includes metadata (e.g., SEASON, PLAYER_NAME, TEAM, etc.) with hockey statistics (e.g., Goals (G), Assists (A), etc.).
- Earlier years have fewer statistics than later years.
There is a lot of data here, but feel free to use the data for your own learning and exploration.
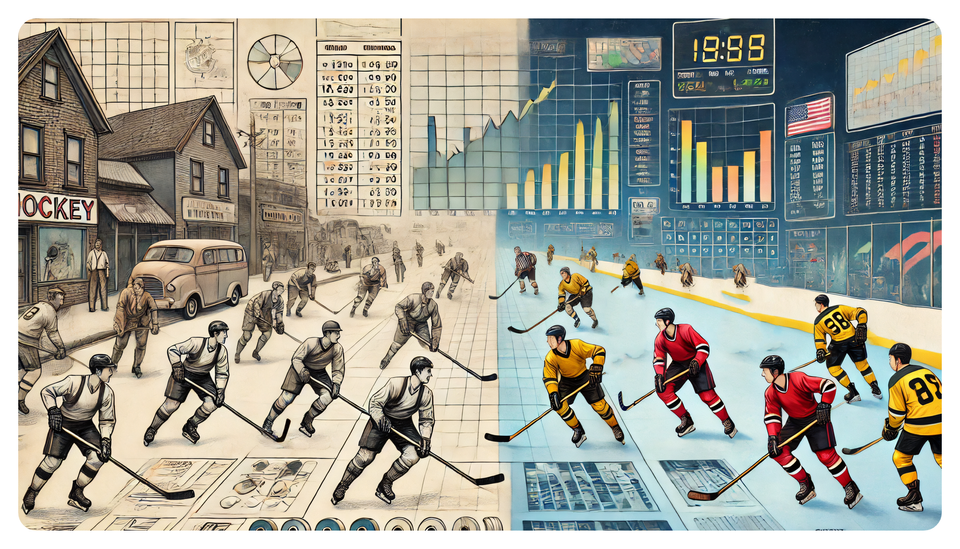
The 80s Versus Today
The NHL of the 80s and today are distinct eras marked by significant changes in the game’s pace, scoring patterns, physicality, and strategic approach. While the core principles of hockey remain constant—teamwork, skill, and competition—the evolution of rules, equipment, and player conditioning has created two markedly different playing styles.
Scoring and Physicality
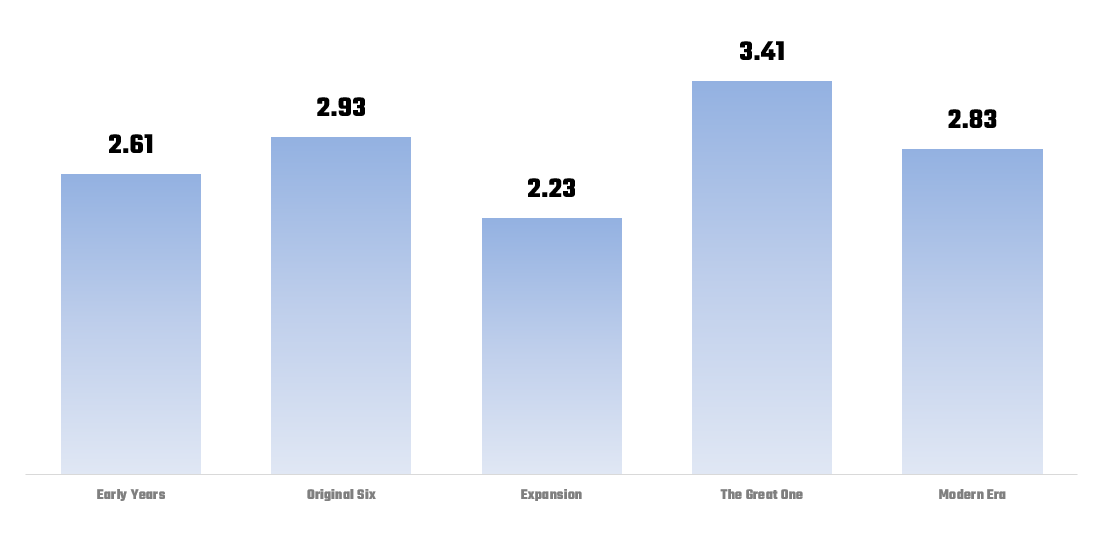
The 80s were the golden age of scoring. In our last newsletter, we highlighted the era called The Great One (which included the 80s) that showed an average 3.41 Goals per Game.
Offensive strategies were driven by creativity and open ice. Legendary players like Wayne Gretzky and Mario Lemieux thrived in this era, posting incredible point totals, thanks in part to a looser defensive structure across the league.
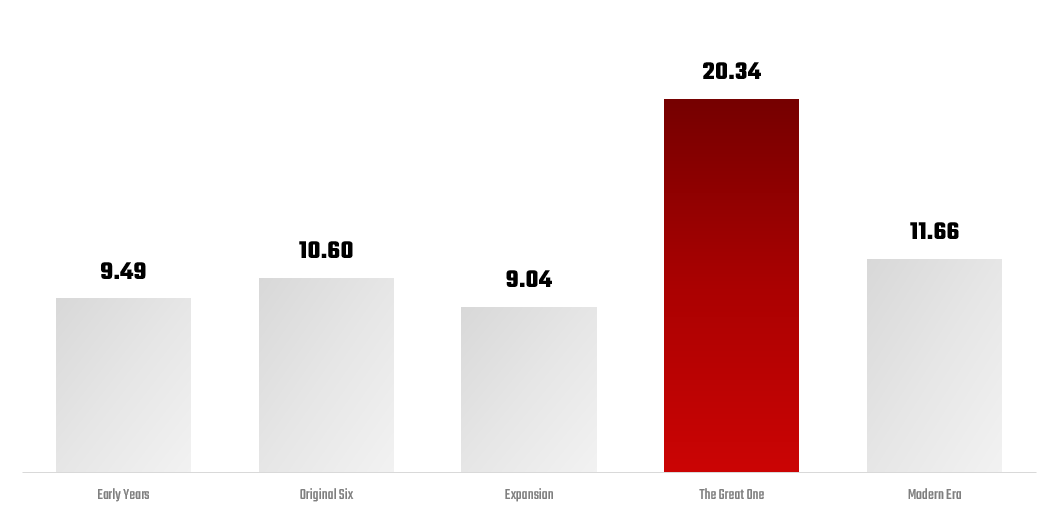
Along with scoring, the physical side of the game was also a defining feature of the 80s. Enforcers played a crucial role on many teams, with fighting and physical intimidation used to protect star players and shift momentum during games. You can see here again, a reflection of the significant delta between The Great One and other areas (Average PIM).
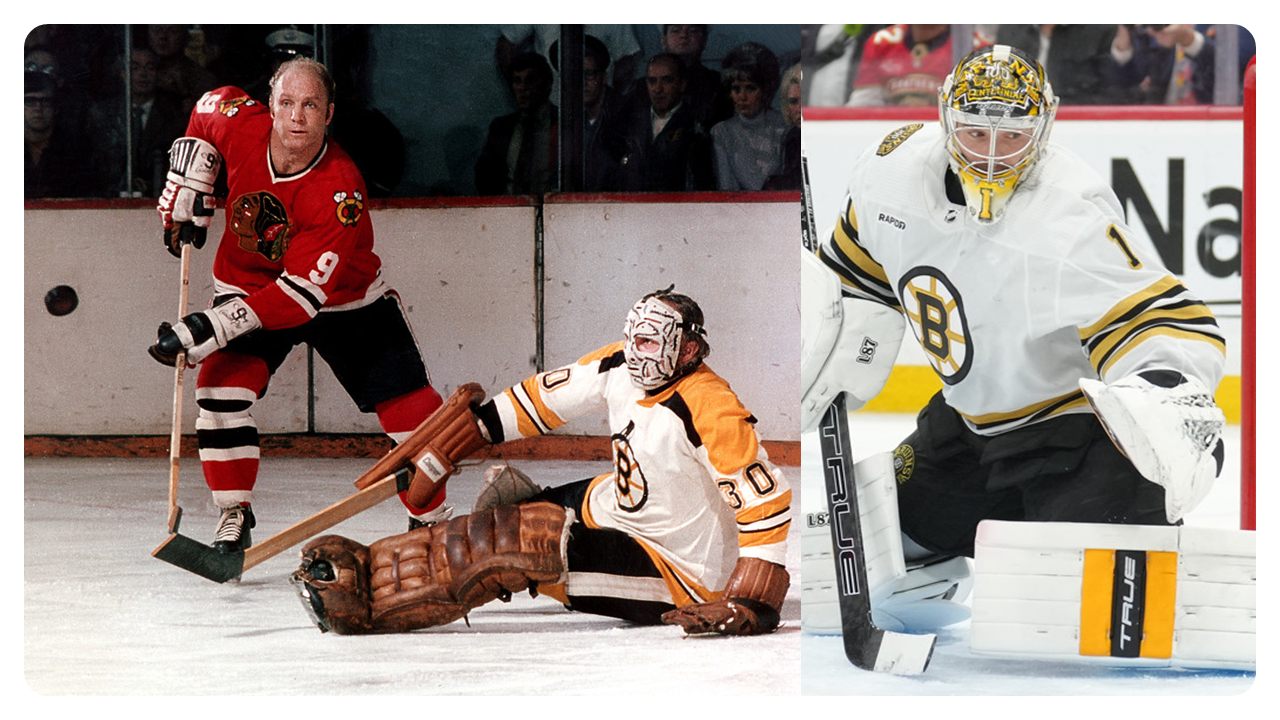
The era’s defensive schemes were often more chaotic, allowing skilled players to exploit breakdowns in coverage. Goaltending, too, was still evolving, with many goalies adopting a stand-up style. The equipment worn by both skaters and goalies was smaller and less protective, which contributed to differences in the game. You can see the comparison below between Gerry Cheevers and Jeremy Swayman.
Today's NHL
Fast forward to the Modern Era, and scoring is more contained, with the league averaging closer to 2.83 goals per game. Defensive systems are tighter, with an emphasis on structured, zone-based play, limiting high-quality scoring chances. Despite this, top-tier players like Connor McDavid and Auston Matthews still rack up impressive point totals, though reaching the same figures of the 80s is far less common.

Today’s game is also characterized by a sophisticated approach to defense. Coaches focus on systems like the neutral zone trap and tight man-to-man coverage, making it difficult for offensive players to find time and space. Goaltending has evolved into a science, with modern netminders evolving their style of play and utilizing advanced techniques to maximize coverage and minimize scoring angles. Equipment is also significantly larger (and goalies taller), contributing to fewer goals scored. While physicality is still present, the role of the enforcer has diminished, and fighting is on the decline, replaced by skill-based confrontations and speed.
Speed and Skill
Perhaps the most striking difference between the two eras is the pace of play. In the 80s, the game was more open, but the overall speed of players was slower compared to today’s NHL. Skating was a critical skill, but players didn’t exhibit the same explosive acceleration seen in modern stars like McDavid or Nathan MacKinnon. Advances in training, nutrition, and technology have enabled players today to be faster, stronger, and more skilled than their 80s counterparts.
Rule Changes and Game Evolution
Several key rule changes have also shaped the differences between these two eras. The introduction of the salary cap in 2005 created greater parity across the league, reducing the dominance of powerhouse teams. Additionally, changes such as the implementation of hybrid icing, stricter penalties for obstruction, and the reduction of goalie pad size have all impacted the flow and physicality of the game. These adjustments were made in part to increase scoring and protect players, a clear contrast from the less-regulated, more rugged game of the 80s.
Can You Compare the 80s to Today?
While you can compare the statistics of players, you must note the significant differences (some of which we've described above) between the 80s and today. Gretzky's style of play came into being at a defining moment for hockey; he was beyond his years and moved the league forward. Further, the enforcers in the league at the time gave him more room to capitalize on the space he was creating in the game.
Today, the feeder systems are creating more and better players each year, and the speed, agility and discipline of a professional hockey player is significantly different from the 80s. While both eras produced generational talent, today’s game is a more controlled and technically advanced version of the free-flowing, tough, and offense-heavy 80s.
Contrasting Gretzky & McDavid
By filtering down the player data to Gretzky and McDavid and focusing on the first nine years of each of their careers, we ran a statistical comparison across three dimensions:
- Basic Head-to-Head Statistics
- Point Production
- Shots
Basic Head-to-Head Statistics
The first table provides a comparison of several statistics between Gretzky and McDavid (averages across their first nine years in the NHL). Overall, Gretzky outperforms across many of the offensive categories, while McDavid excels in modern aspects of the game like shooting and clutch goals.
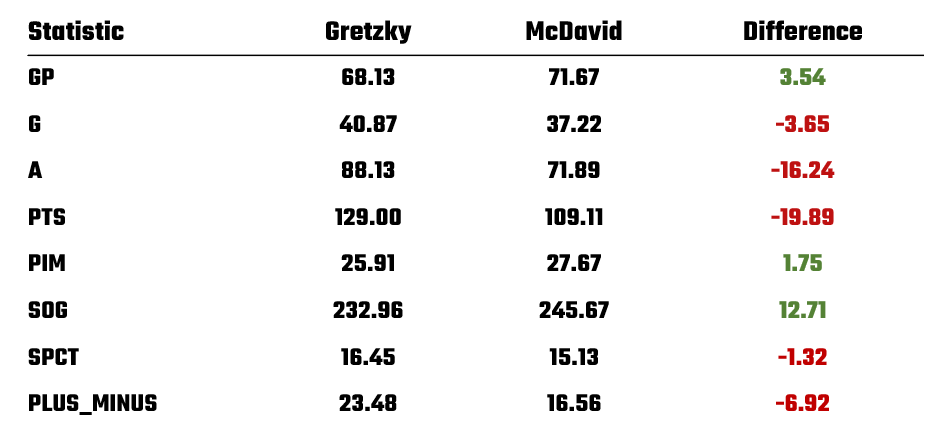
On pure averages across the sample period, Gretzky has more significant point production, shot percentage statistics and plus/minus. However, both players have very impressive statistics. And despite the different eras, both players have had extraordinary impacts, with McDavid proving himself a generational talent in a tighter, more defensively focused NHL.
Point Production
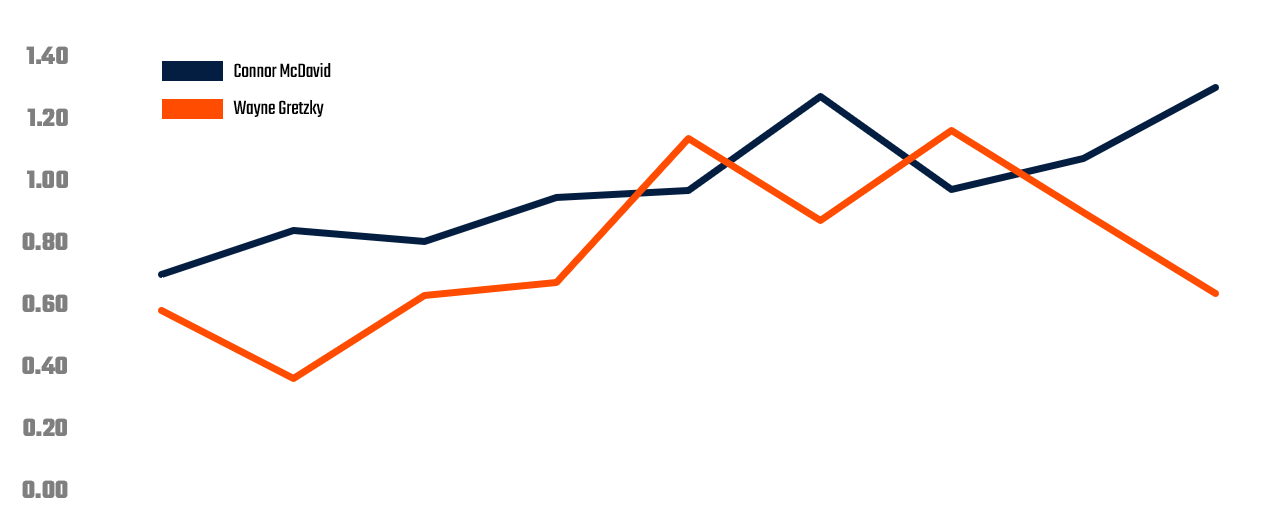
A single average is one thing, but a trend tells a more complete story. The line chart below compares Gretzky and McDavid's average Points per Game (PPG). From this chart, we see that Gretzky outpaces McDavid early on, averaging about 0.37 more PPG in their rookie seasons. This shows Gretzky’s immediate impact on the league. Their performance is relatively consistent for the next couple of years, but in Gretzky's fifth year, the gap widens – significantly, after which he continues to maintain a lead.
Gretzky’s highest PPG came in year seven, where he posted an impressive 2.77 PPG, a number that far surpasses McDavid’s best season (1.88 PPG in year six). McDavid’s PPG gradually rises and shows consistency, especially from years four through eight, but it never approaches the highs that Gretzky reached.
Gretzky’s sustained offensive dominance, especially between years three and seven, demonstrates his ability to generate points at an extraordinary rate. His era was more conducive to higher scoring, but his individual output was unprecedented.
The difference in era plays an important role in interpreting this data. Gretzky played in a higher-scoring era, where offensive output was more frequent, while McDavid plays in a more defensively structured, lower-scoring NHL. McDavid shows a steadier increase in point production over time, whereas Gretzky surged early in his career and maintained an extremely high level throughout. McDavid's more gradual rise reflects the increased difficulty in generating points in today’s game.
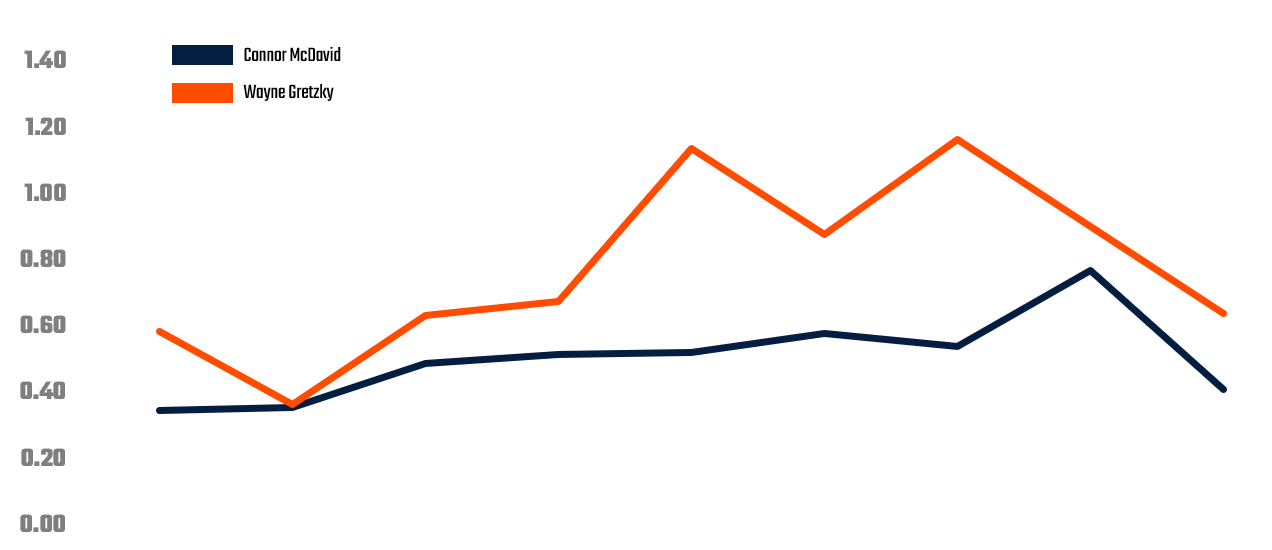
It's worth noting, and perhaps a little strange given Gretzky's point production, that McDavid might be considered more of a playmaker of the two. For example, this second line chart compares McDavid and Gretzky's average Assists per Game (APG). The data reveals that McDavid demonstrates a consistent assist production throughout his first nine seasons. His APG steadily increases in most seasons, peaking in year six and again in year nine.
Conversely, Gretzky’s assist production fluctuates more across his first nine seasons. He starts slower but has a surge from years five to seven, where he surpasses McDavid in assists. However, he experiences dips in both his second and ninth seasons, which lowers his overall APG.
Game Winning Goals
While the number of goals is important, so is when you score those goals. That is, Game-Winning Goals (GWG) can indicate that players are good in clutch situations. This visualization compares the number of GWG scored by McDavid and Gretzky.
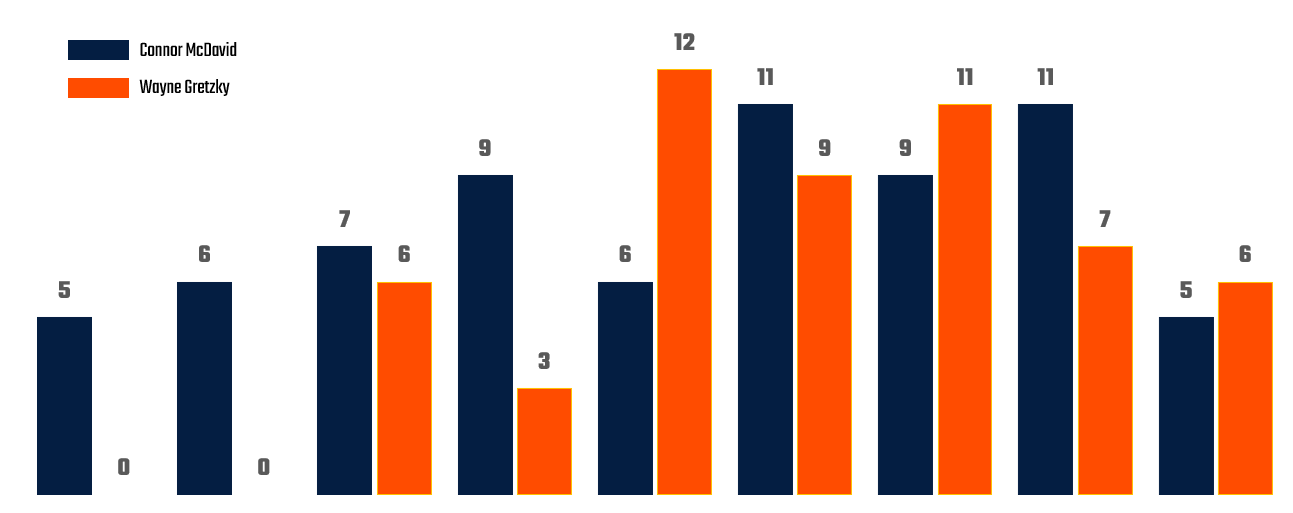
From this chart, you can see that McDavid dominates the first four seasons in terms of GWG. His ability to step up in clutch moments early in his career is evident, with a strong advantage over Gretzky, who didn’t score a game-winning goal until his third season.
However, from years five to seven, Gretzky begins to show his prowess in clutch situations, particularly in year five where he scores 12 game-winning goals. This represents a key period where Gretzky overtakes McDavid and demonstrates his ability to be decisive in close games.
Overall, though, McDavid averages stronger across the entire nine-year period with 8 GWGs compared to Gretzky's 6.
Shots
This final chart compares Connor McDavid and Wayne Gretzky’s Shot Percentage (SPCT) over their first nine seasons, along with the difference between their percentages. The chart shows that Gretzky consistently demonstrates a higher SPCT than McDavid across all nine seasons, indicating that he was generally more efficient at converting shots into goals. Gretzky's peak years (years 5 and 7) show an incredibly high SPCT, with over 24% and 26% of his shots resulting in goals. This remarkable efficiency suggests that Gretzky’s finishing ability was one of the key elements that set him apart during his career.
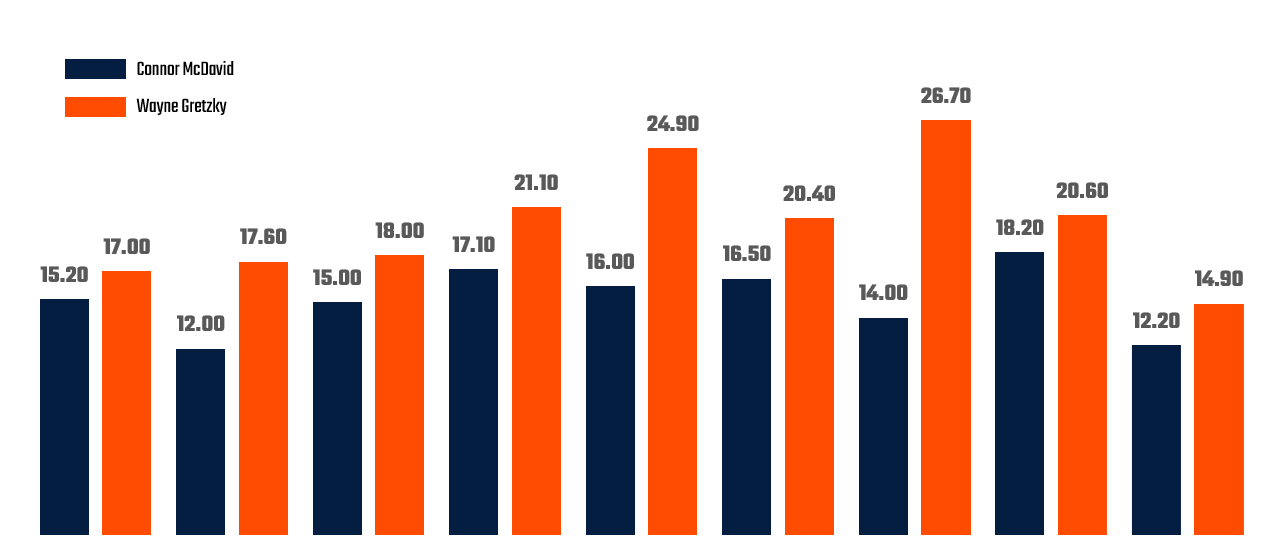
That said, McDavid has a solid SPCT throughout his first nine seasons, peaking at 18.2% in year eight, but he never quite reaches the same levels as Gretzky.
Where McDavid does excel, on average, is his overall Shots on Goal (SOG), which was 245.67 compared to Gretzky's 232.96. A higher SPCT in the 1980s likely means that the game was opening up and Gretzky's style of play was testing the goaltenders of the day. In our Modern Era, the game is quicker and goaltending has improved, so a higher SOG may not mean a higher conversion to goals. The stat, though, is impressive nonetheless.
So, What Does This All Mean?
First, Gretzky and McDavid are a part of an elite short-list of NHL players. So, no matter how you slice it, they're amazing players in their own right within the era in which they played/are playing.
Second, their respective eras are very different, so a head-to-head statistical comparison is only partly useful. We did it here, but a follow-on exercise would be to include other statistics within their own era. The Great One era had higher scoring, it was the time of the enforcer, goaltending was adjusting to the changing style of play, and Gretzky had a different composition of player around him. The Modern Era is a faster and tighter game, goaltending has improved dramatically, rules have evolved, and offensive zone play is much tighter and in some cases impregnable.
All that notwithstanding, Gretzky changed the game and his production has broken (and maintains) all sorts of records. It was a major pivot for the NHL. However, McDavid has showed he's a strong playmaker and can score clutch game-winning goals. He also is sure to have a long and record-making career in the NHL.
We've packaged this newsletter up into a quick-hit video, which you can check out on YouTube!
Summary
In this newsletter, we introduced the full dataset of player data and explored and compared two eras: The Great One and the Modern Era. We did this through a high-level comparison between Gretzky and McDavid, two elite NHL players.
We compared the two players across three dimensions: basic statistical averages, point production, and shots. Each of the dimension exposes different parts of the two player's games. For example, the data supported what we all know: Gretzky had an amazing career with high production that changed the game. However, we also saw that McDavid is a playmaker that can produce with clutch goals. And in his own right, he is helping shape the modern game.
If you want to download and conduct your own analyses, you can find the player statistics dataset below:
Subscribe to our newsletter to get the latest and greatest content on all things hockey analytics!
Member discussion