Preparing for the NHL 2024 Draft: Analyzing Incoming Prospects

In this Edition
- Draft 2024 Prospect Newsletter Series Recap
- Getting Started with the Data
- Data Discovery for the NHL Draft 2024 Prospects
- Creating a Power BI Dashboard for the NHL Draft 2024 Prospects
Draft 2024 Prospect Newsletter Series Recap
This is Week 4 in our six-week newsletter series on Preparing for the NHL Draft 2024. In the first three editions, we covered the following topics:
- Week 1 Edition: Introduction to the six-week series.
- Week 2 Edition: Overview of the data discovery process using Microsoft Excel and a high-level walkthrough using the team stats dataset.
- Week 3 Edition: Analyzing the NHL teams for strengths and weaknesses across offense, defense and goaltending.
In this week's edition, we'll explore the incoming NHL 2024 draft prospects in two ways:
- Data Discovery: Explore the NHL 2024 Draft prospects dataset through data discovery using Microsoft Excel.
- Incoming Prospects Dashboard: Explore the demographics, offense, defense and goaltending metrics on the NHL 2024 Draft prospects using Power BI.
Let's get started!
Getting Started with the Data
Before you download and explore the dataset, you may want to check out two resources for the NHL Draft 2024 prospects from the NHL and Elite Prospects.
The first is the NHL Draft Prospects page, which provides a ranked view of prospects from North America and those that are international. This is a good starting page to give you some basic information about the incoming draft prospects.
The second is the Elite Prospects NHL Draft Guide 2024, which provides a comprehensive ranking and categorization of players. There's a ton of information in the guide, including a grading from A to F – see below – for mapping the prospects to specific draft rounds.

If you're looking for detailed ranking, assessments and commentary on this year's incoming draft class, then this guide is a great addition to your analyses.
About the Incoming Prospects Dataset
If you're reading this newsletter, then you likely want to do your own analysis, so we've created a dataset that merges data from different sources across the web into one dataset. We've also added some calculated metrics of our own, so you can do some data discovery and explore the core statistics of the 2024 draft prospects. The Incoming Prospects Draft 2024 dataset is here.
The dataset contains a mix of metadata (e.g., Nationality, Position, Age, etc.) and raw and calculated statistics (e.g., Games Played, Goals, Assists, etc.). We've created a few calculated statistics that may also help your analyses (e.g., Potential Points, Games/Assists/Points Per Game, Points Percentage, PIM Per Game, GAA, and Save Percentage.
Initial Observations
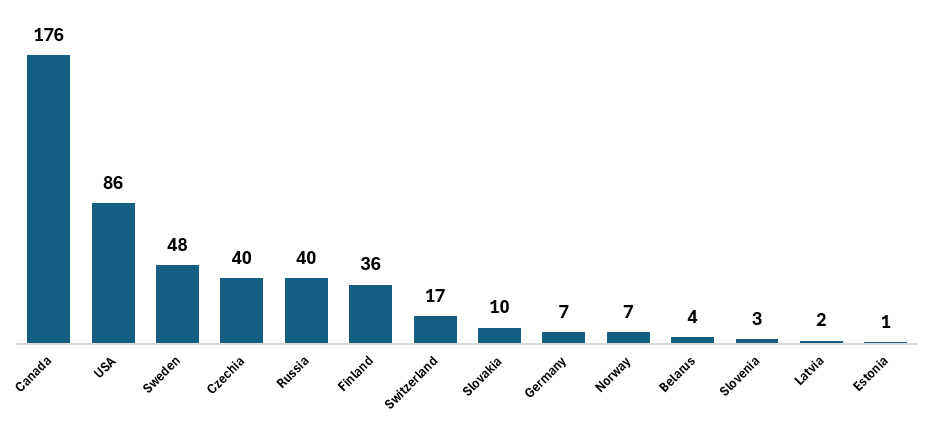
From our dataset (n = 477), we made a few general observations. For example, from our sample the top five contributing countries to this year's incoming draft cohort are Canada (37%), USA (18%), Sweden (10%), Czechia (8.4%), and Russia (8.4%). Below is a fuller view of the distribution of nationality within the sample.
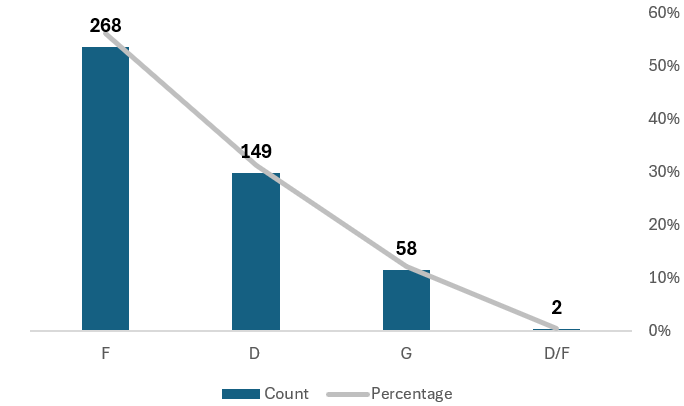
Further, forwards comprise roughly 56% of the prospects, defensemen make up 32%, and goalies 12%. Note that in the raw data you'll see more categories (e.g., RW/LW, C/RW, etc.); however, we collapsed the categories here a bit for better viewability.
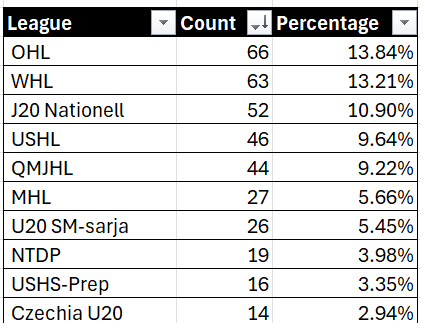
Out of these players, the top-producing leagues are the OHL, WHL and J20 Nationell. We've captured the top ten prospect-producing leagues below.
At the team/program level, we found a short-list that were high producers: US National U18 team produced 19 (4%); the HV71 J20 produced 10 (2%); the Mississauga Steelheads produced 7 (1.5%); the Muskegon Lumberjacks produced 7 (1.5%); and Shattuck St. Mary's 18U Prep produced 6 (1.3%).
Data Discovery for the NHL Draft 2024 Prospects
To make data discovery more interesting, we're going to sort our dataset on the first 50 prospects (skaters only) that are listed on Elite Prospects.
For the data discovery, we'll do the following:
- Open the dataset in Microsoft Excel.
- Format the dataset as a table (select Format as Table, select a table style and confirm the table range).
- Filter on RANK and filter on the top 50 prospects. (There shouldn't be any goalies in the top 50, but if there are, filter goalies out.)
- Categorize the skaters into forwards and defense.
- Explore some of the different metrics across these two categories by creating a heatmap and sorting on different statistics.
Let's first explore the defensemen within the first 50 prospects, of which there are 18. Below is a snapshot of these defensemen, sorted in descending order on Points Percentage (PTS_PCT) – not ideal for this position, but we'll start our data discovery here.
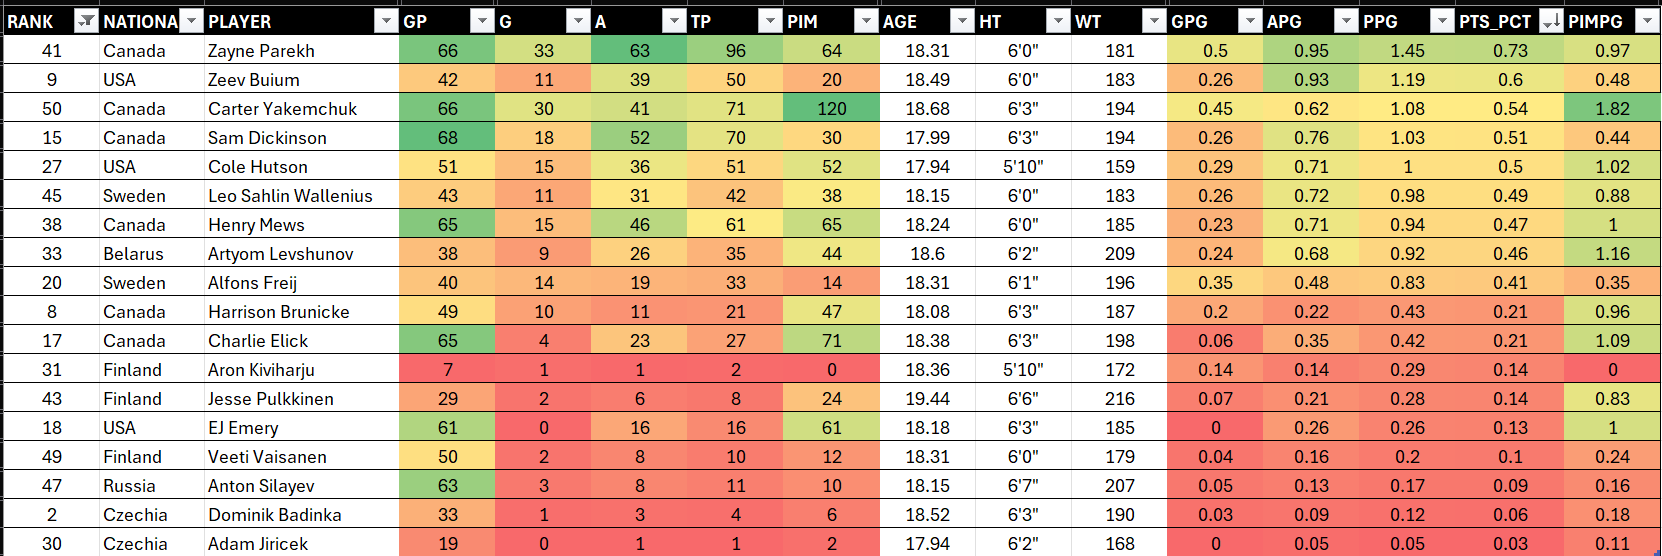
You can use the heatmap to explore the different defensemen and how they stack up against one another from a numbers perspective. For example, Zayne Parekh appears to be a decent offensive-defenseman with good point production; Zeev Buium is strong as a playmaker (judging by his assists), takes fewer penalties, but comes in under the average weight of a defenseman; and Carter Yakemchuk has a high PIM, decent point production and has some size on him. And in some ways, you can also see the ranking in this view maybe doesn't matter as much.
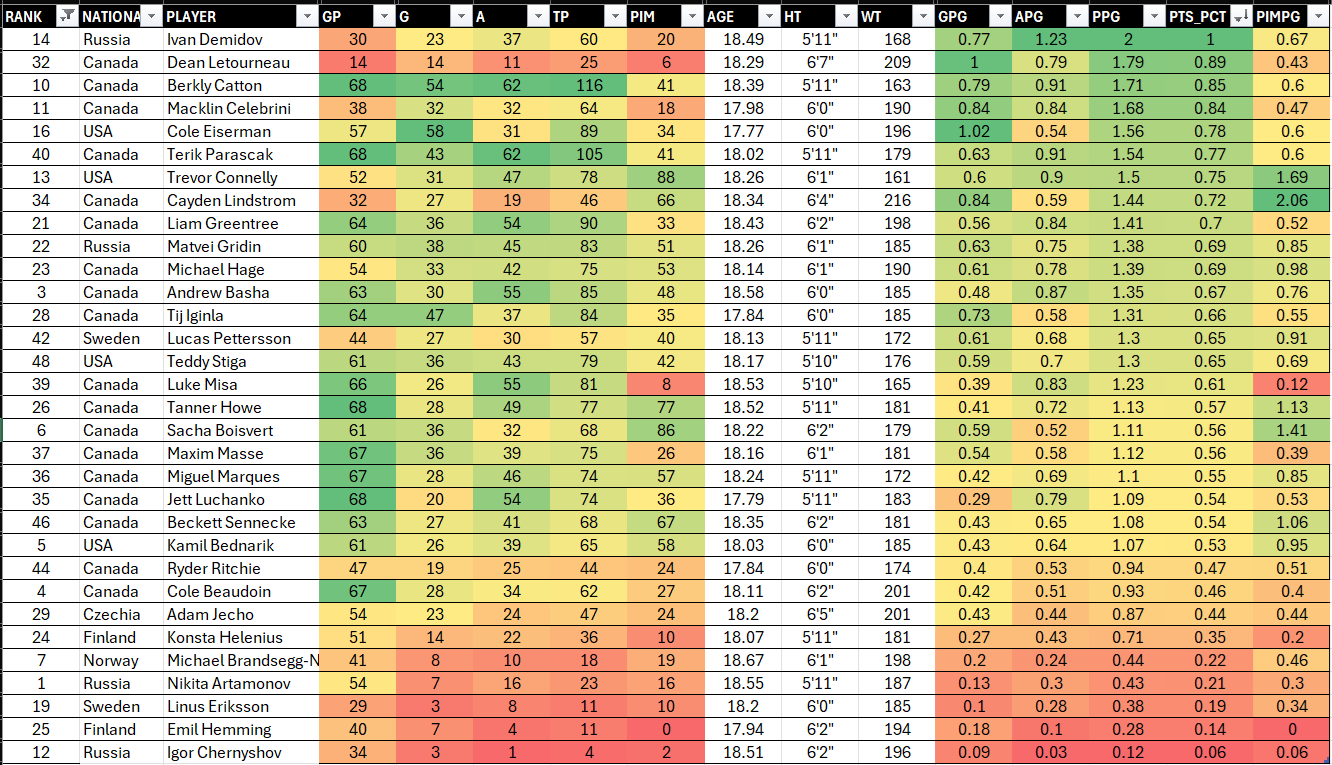
Given the stats in our dataset tend to favor the forwards, when we similarly explore this cohort you find some interesting results. Note that we've sorted the below on Points Percentage again, so you can get a good sense of how players compare to one another given the available statistics.
Ivan Demidov has a solid points per game statistic – both from a goal-scoring and assist perspective, has lower PIM, but is a bit smaller than others in his cohort. Berkly Catton and Macklin Celebrini have also racked up some decent point-production statistics and have lower PIM, which is good. Interestingly, Trevor Connelly and Cayden Lindstrom are both physical players with decent point production with Cayden having some serious size to him.
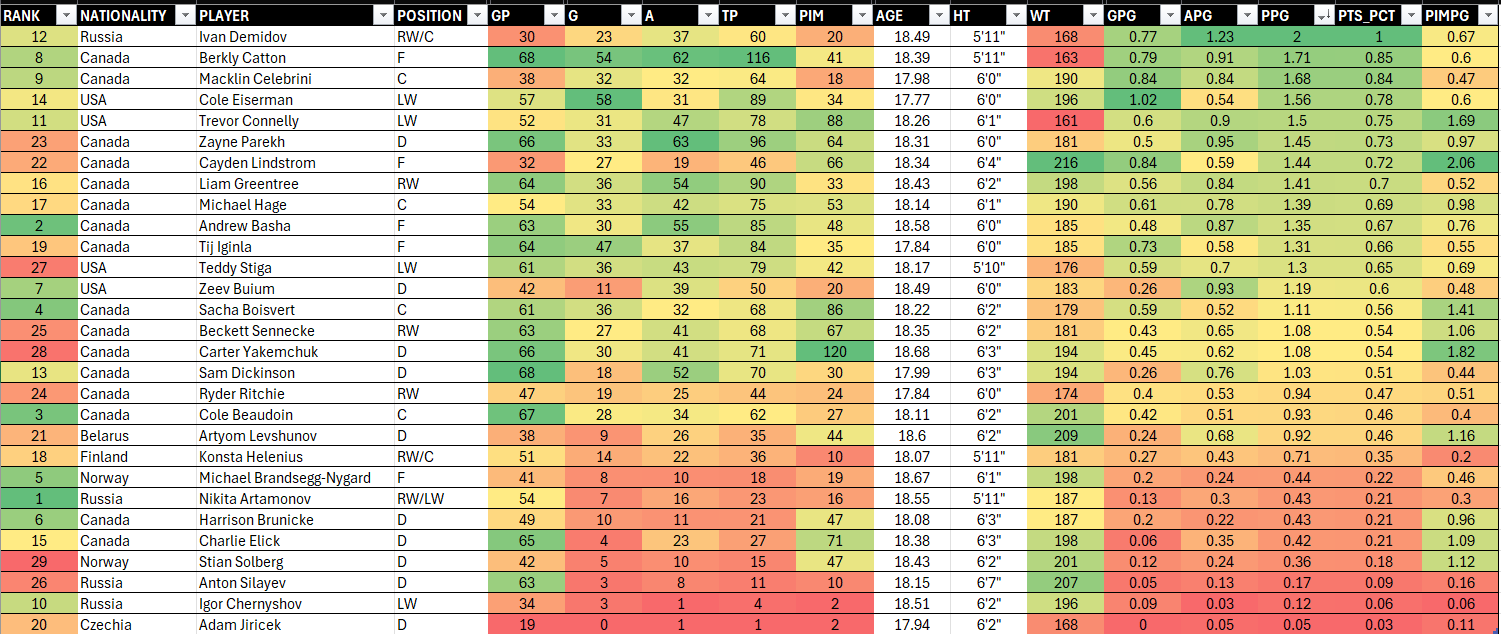
Where the draft prospect dataset gets interesting is when you take the prospects that got graded an A in the Elite Prospects Draft Guide. This way you have numbers to compare the top prospects (n = 29) and you have additional commentary on each of these players in the Elite Prospects Draft Guide. We love heatmaps because they are a super easy way to compare the performance metrics of players – moving players up or down in ranking depending on the sort criterion. For example, when you sort this dataset on Points Percentage (PTS_PCT), some of the higher-sorted prospects drop down the list a bit – e.g., Nikita Artamonov, Michael Brandsegg-Nygard and Harrison Brunicke.
Raw numbers, however, are never enough when evaluating prospects. So, we'd recommend reviewing reviewing the Elite Prospect Draft Guide if you want a broader perspective on each player in the above list. For example, while Ivan Demidov is ranked first when sorting on Points Percentage, Macklin Celebrini is ranked first overall given the broader scouting considerations and attribute ratings noted within the Elite Prospect Draft Guide – see below.
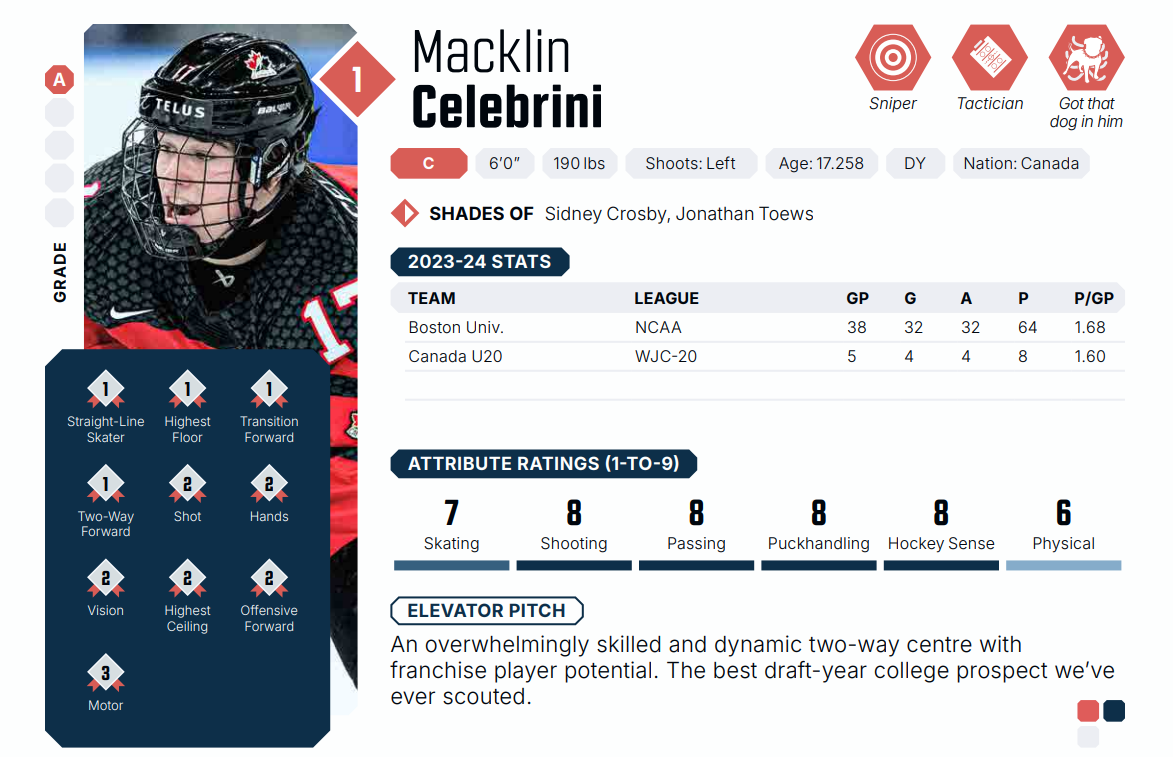
In short, the heatmap gives you a quick analytical comparison, and the guide gives you a deeper dive into Elite Prospect's rating and grading system along with scouting and NHL commentary.
Creating a Power BI Dashboard for the NHL Draft 2024 Prospects
Data discovery in Excel lets you quickly explore the data, but you may need an artefact with pre-defined views. So, we've created a Power BI dashboard that includes the data from all 477 prospects. It includes reports for demographics and then offensive, defensive, and goaltending metrics.
Power BI Report Design
We created a background design for the Power BI dashboard in PowerPoint using some simple formatting and font selection. You can see below the style we used for this dashboard. Note that we included the titles in the background, which can take some flexibility away from you in the visualizations if you're changing up on the fly.
We created four reports within this dashboard:
- Demographics Report – focuses on Age and Nationality
- Offense Report – focuses on GPG and APG
- Defense Report – focuses on PGP and PIM
- Goaltending Report – focuses on GAA and Save Percentage
Let's walk through each one.
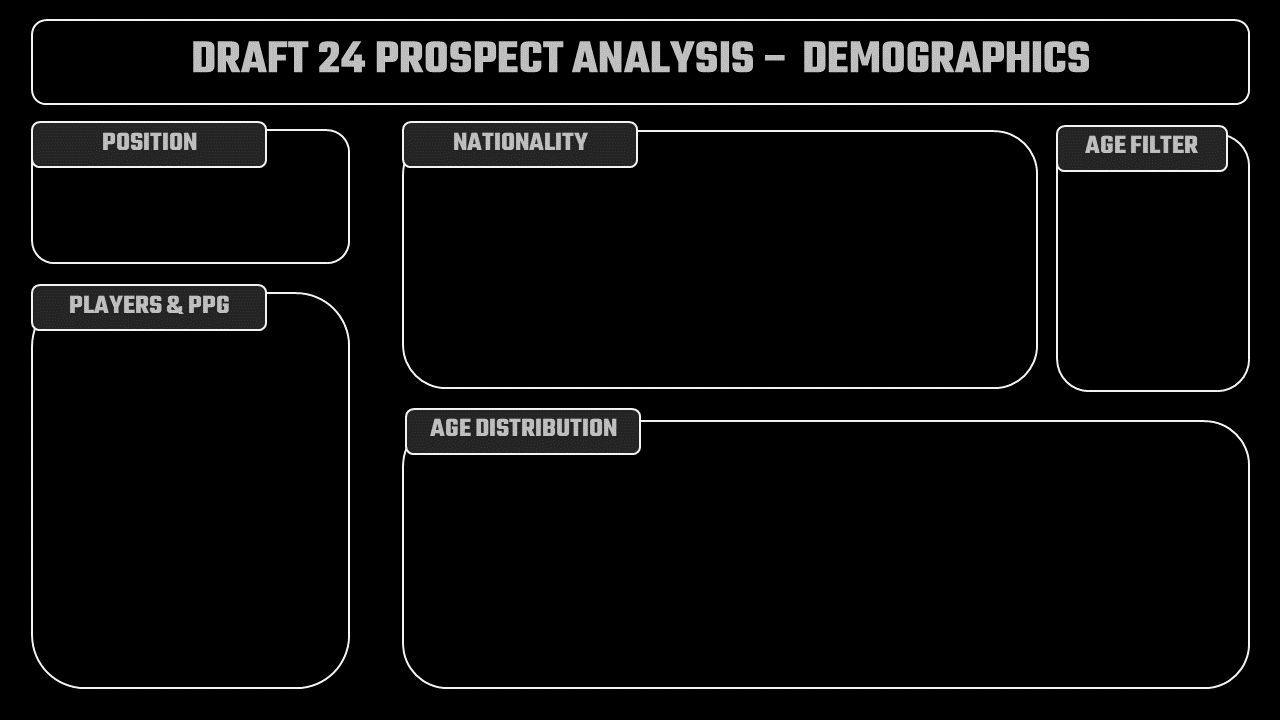
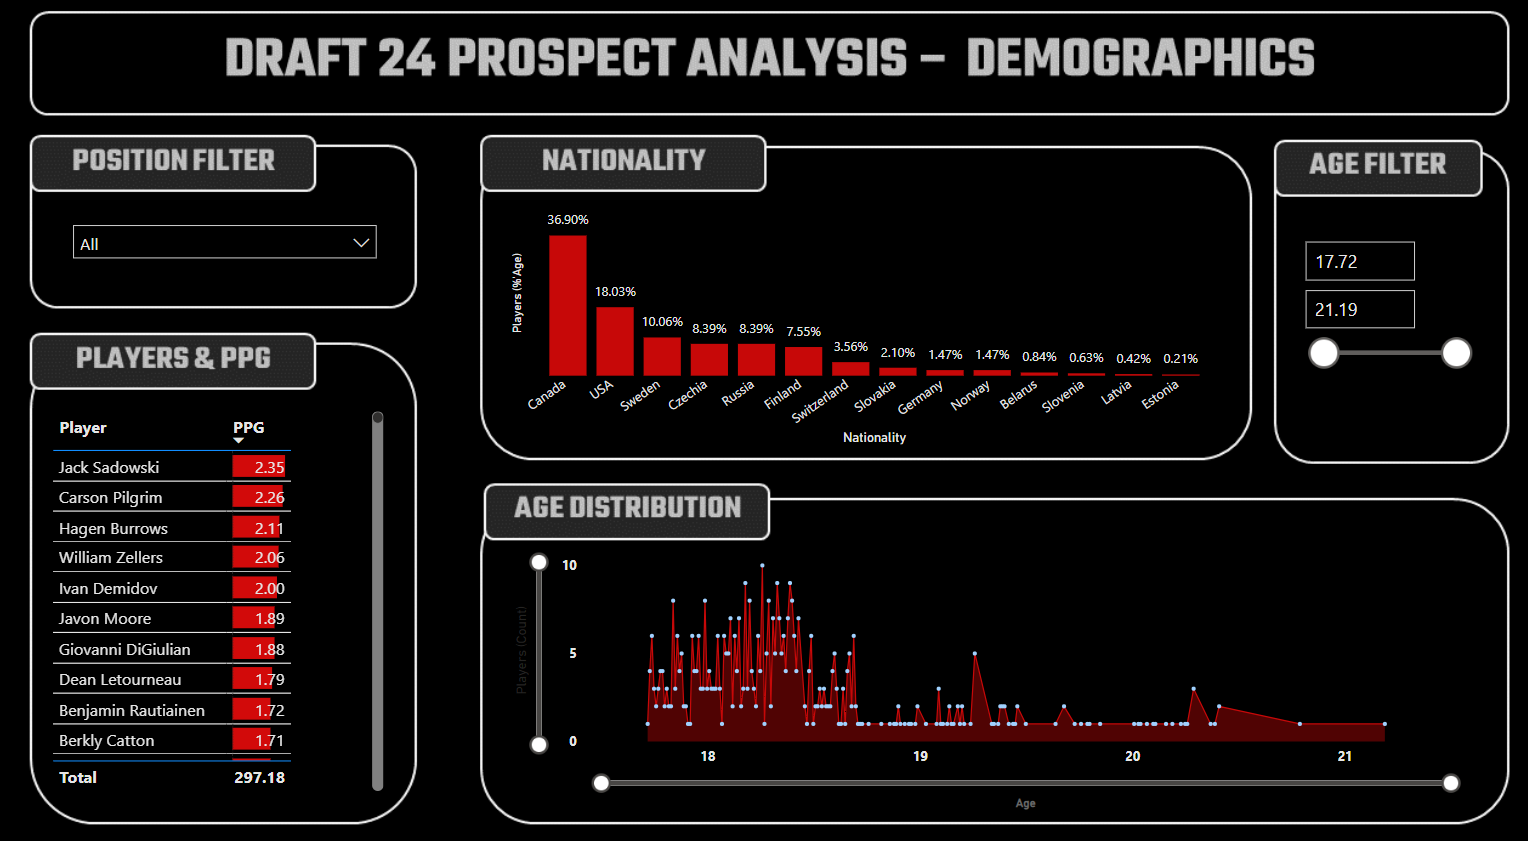
Demographics Report
The Demographics Report includes five controls:
- Two Slicers, one for POSITION and one for AGE.
- One Table with two columns: PLAYER and PPG.
- One Clustered Column Chart with NATIONALITY as the X-axis and PLAYER as the Y-axis. (The Y-axis is configured to be Percentage of Total.)
- One Area Chart with AGE as the X-axis and PLAYER as the Y-axis – leaving the default as Count for PLAYER.
You can see below how we structured the background design.
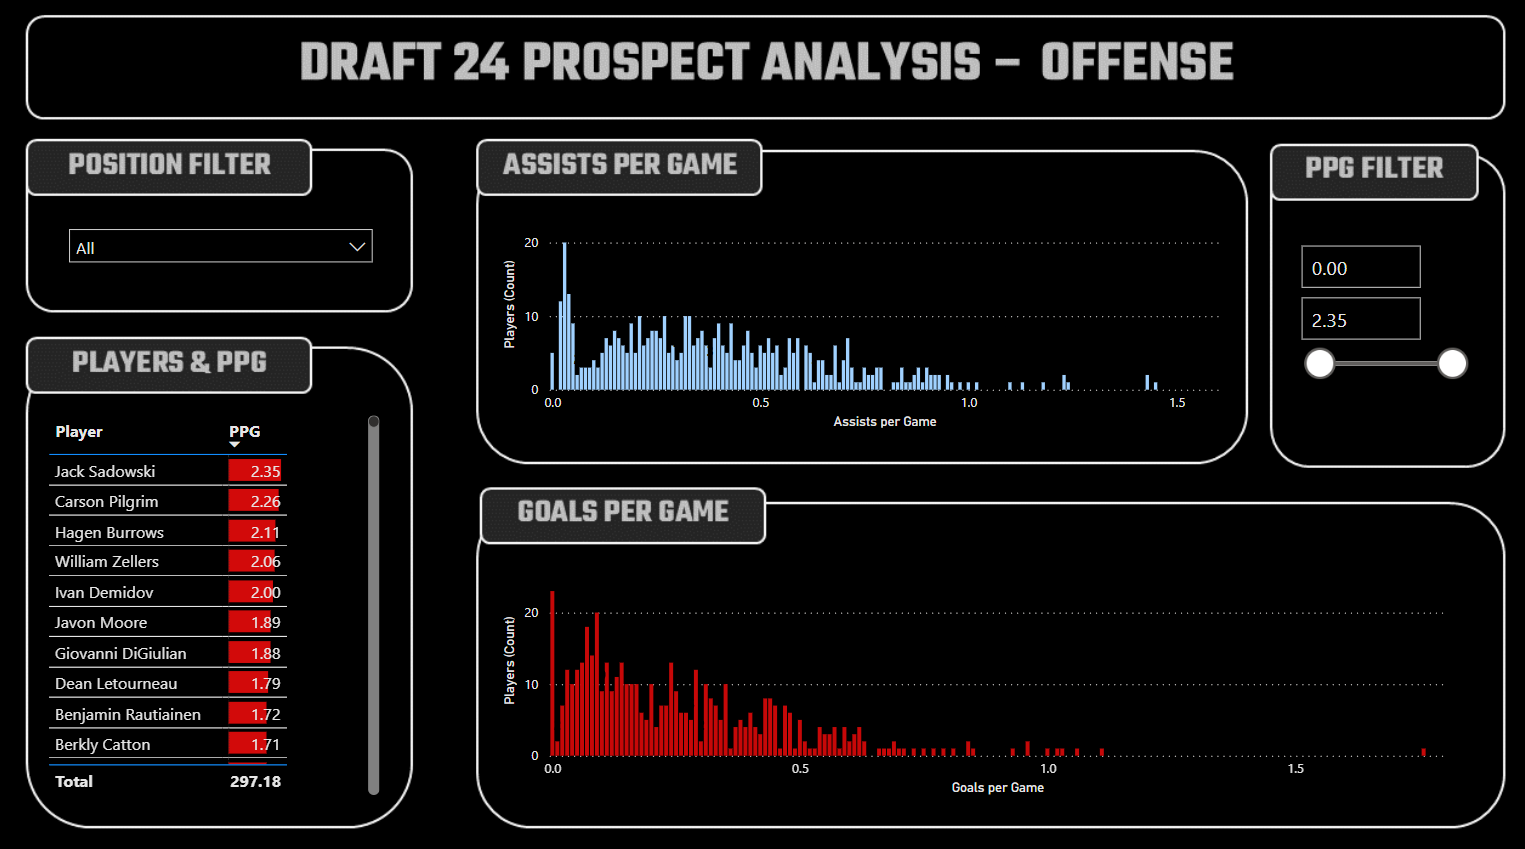
Offense Report
The Offense Report includes five controls:
- Two Slicers, one for POSITION and one for AGE.
- One Table with two columns: PLAYER and PPG.
- One Clustered Column Chart with APG as the X-axis and PLAYER as the Y-axis.
- A second Clustered Column Chart with GPG as the X-axis and PLAYER as the Y-axis.
The background design for the Offense Report was similar to the previous report.
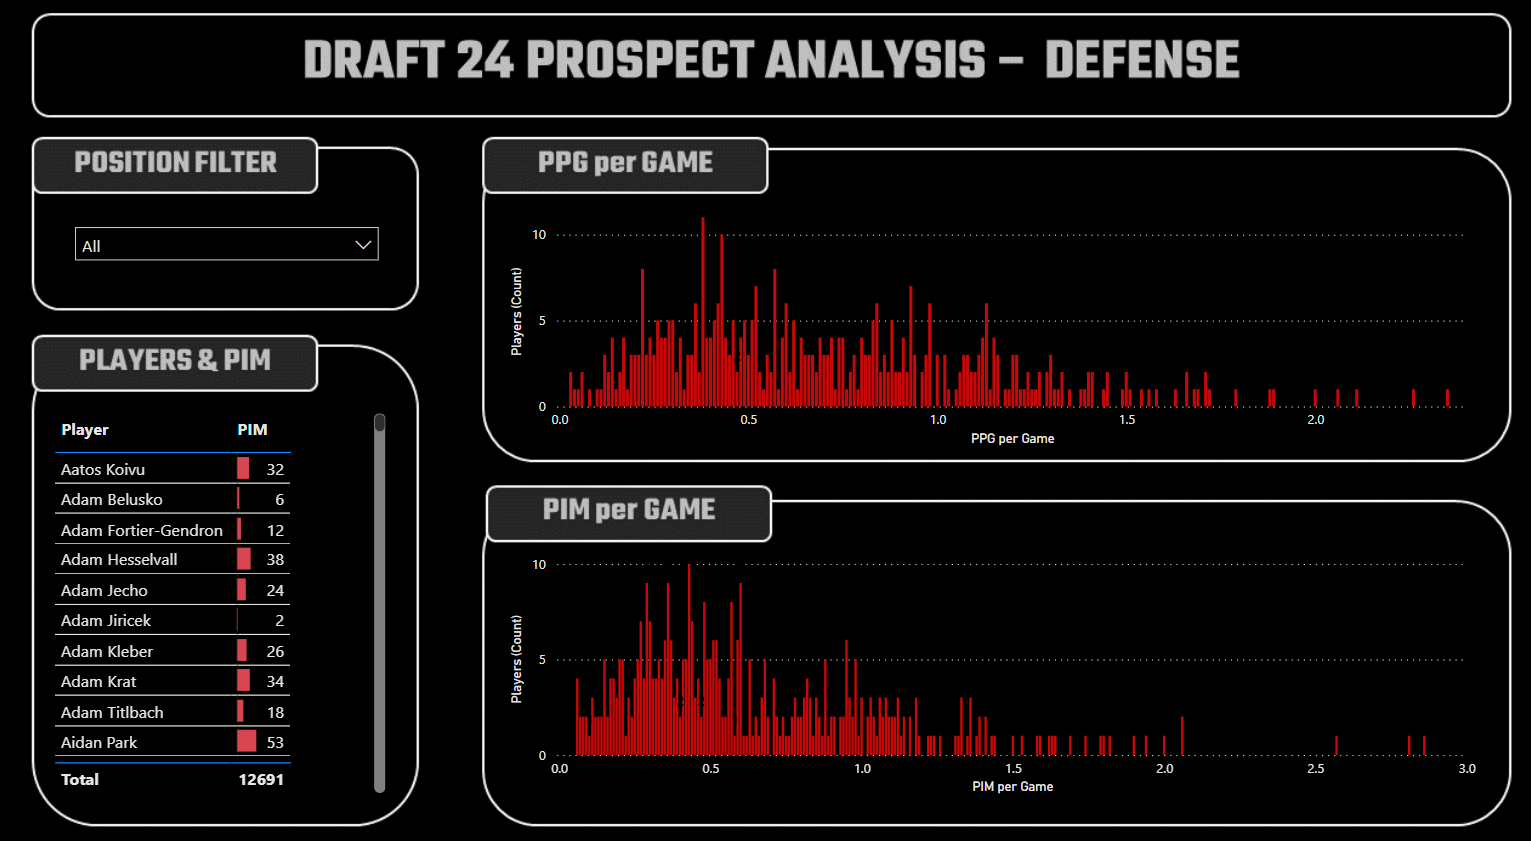
Defense Report
The Defense Report includes four controls:
- One Slicer for POSITION.
- One Table with two columns: PLAYER and PIM.
- One Clustered Column Chart with PPG as the X-axis and PLAYER as the Y-axis.
- A second Clustered Column Chart with PIMPG as the X-axis and PLAYER as the Y-axis.
The background design was slightly different here as we removed the Age Slicer.
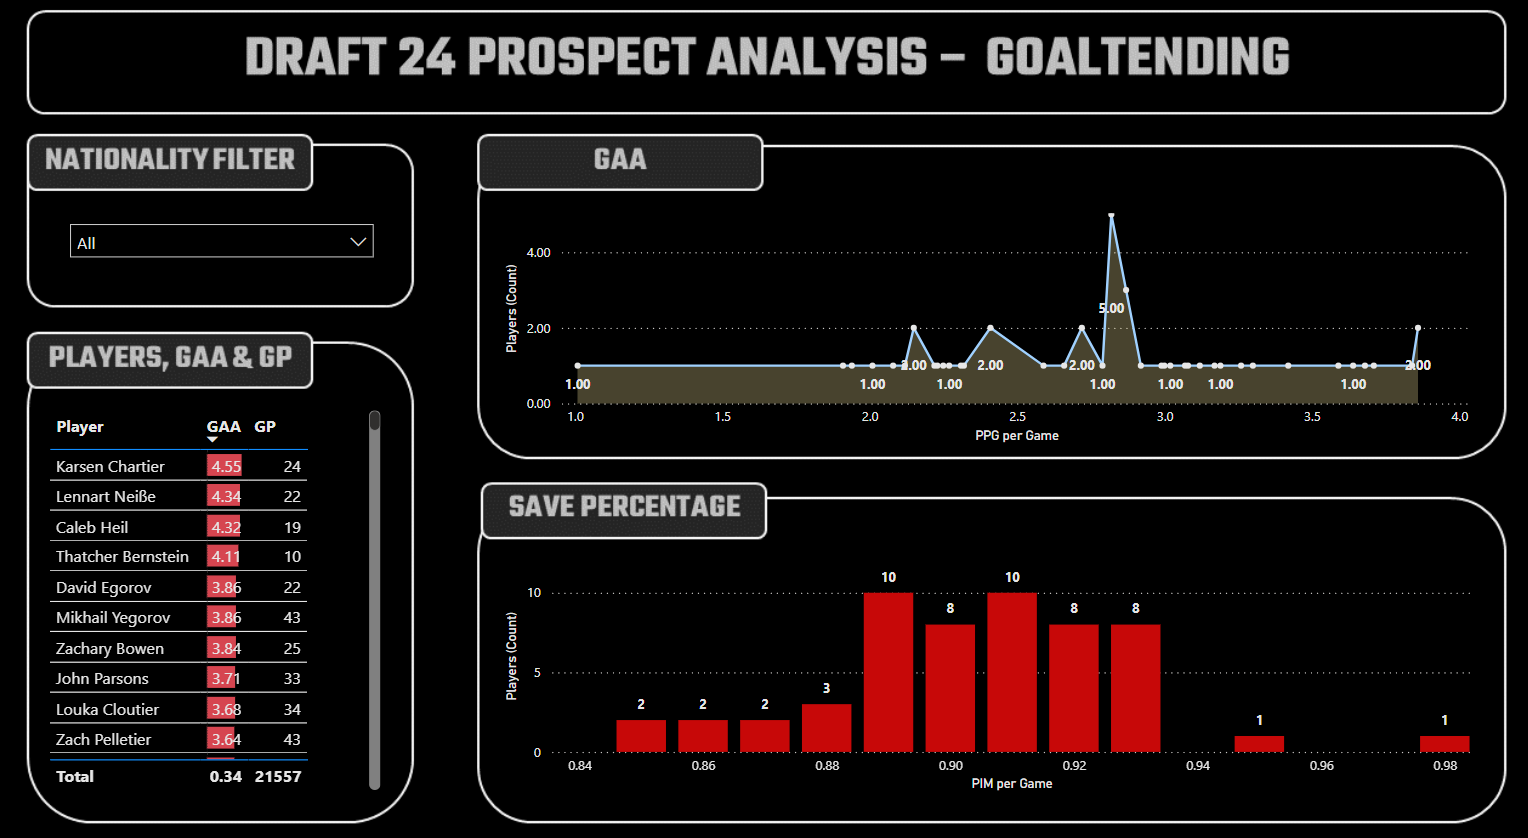
Goaltending Report
The Goaltending Report includes four controls:
- One Slicer for NATIONALITY.
- One Table with three columns: PLAYER, GAA and GP.
- One Area Chart with GAA as the X-axis and PLAYER as the Y-axis.
- One Clustered Column Chart with SAVE_PCT as the X-axis and PLAYER as the Y-axis.
The background design was slightly different here as we again removed the Age Slicer. Note that we included the GP column in the table because of the varying amount of games played by these goalies.
You can download and explore the dashboard from here.
You can also check out our quick-hit YouTube video below:
Summary
In this week's newsletter edition (Week 4 in our six-week Preparing for the NHL Draft 2024 series), we began to explore the incoming draft prospects. We did by 1) exploring the available data on the prospects through the process of data discovery in Microsoft Excel; and 2) creating a Draft 2024 dashboard using Power BI.
The downloads for this week are below:
We also referred you to a couple of good draft resources, the NHL Draft Prospects page and the Elite Prospects Draft 2024 Guide. We would recommend using the views/reports we created here as ways to explore and compare the draft prospects analytically and then use the other two resources (especially the Elite Prospects guide) to get deeper information from scouts, ranking and other assessments.
In Week 5, we will continue to focus on the incoming draft prospects, but we'll focus in on the top prospects so we can map prospect strengths to NHL team weaknesses.
Subscribe to our newsletter to get the latest and greatest content on all things hockey analytics!
Member discussion