Discover Fantasy Hockey Outliers using the Average DFS Projections Score

In this Edition
- What are DFS Projections?
- What are Examples of Fantasy Hockey Scores?
- What is the Average DFS Score?
- How do You Use the Average DFS Score with other Hockey Stats?
- Creating Social Content from DFS Projection Stats
What are DFS Projections?
Daily Fantasy Sports (DFS) Projections refer to the forecasted performance statistics for athletes in sports games. DFS Projections are used by fantasy sports enthusiasts to make informed decisions when constructing their fantasy teams. The projections typically include various statistical outputs such as points, assists, goals, rebounds, blocked shots, or other relevant hockey stats.
DFS projections are based on a combination of factors, including but not limited to:
- Historical Performance: Analyzing past game data to predict future performance.
- Player Conditions: Considering injuries, rest days, or any other factor that might impact a player's performance.
- Matchup Analysis: Evaluating the strengths and weaknesses of opponents to assess how a player might perform against them.
- Team Dynamics: The role of the player within their team, including their position, expected playing time, and how their team's offensive and defensive strategies might impact their performance.
The objective of DFS Projections is to quantify a player's expected contribution in fantasy points for a given contest. These projections are used by DFS players to select athletes who are expected to provide the best value relative to their cost, thereby maximizing the team's overall performance within the constraints of a salary cap. Tools and models that generate these projections often use complex algorithms and statistical analyses, and they are central to a competitive DFS strategy.
What are Examples of Fantasy Hockey Scores?
In this edition, we use scores from four common DFS platforms: FanDuel, DraftKings, Yahoo, and FanDraft. Each has a slightly different scoring systems and rules, which is why DFS points can vary across them. Each platform develops its own set of rules and scoring criteria based on its goals, target audience, and the sports it covers. Here are some differences that contribute to the variation in DFS points across these platforms:
- Scoring System: Providers have a unique scoring system that assigns different point values to various in-game actions and achievements, such as goals, assists, shots on goal, saves, blocked shots, and more.
- Position Eligibility: The eligibility rules for player positions can differ, affecting how participants can assemble their rosters. This variation can influence point totals, as it impacts the strategic composition of teams.
- Salary Cap: While most DFS platforms use a salary cap system to add strategy to roster construction, the specific cap amount and player pricing algorithms may vary. This leads to different strategies in selecting players who are likely to outperform their value on each specific platform.
- Bonus Points: Some platforms offer bonus points for certain achievements, such as hat tricks in hockey. The presence or absence of these bonuses, as well as the specific achievements that are rewarded, can cause point discrepancies.
- Roster Structure: The required lineup composition can vary, with some platforms requiring a different number of players from specific positions or categories. This affects strategic decisions and ultimately the scoring outcomes.
- Contest Types and Rules: The variety of contest formats (e.g., tournaments, head-to-head, 50/50s) and specific game rules (e.g., late swap options) can also influence scoring strategies and outcomes.
These differences are designed to cater to diverse preferences among fantasy sports participants, providing various levels of complexity, strategy, and engagement. Players often choose the platform that best aligns with their preferences for gameplay, strategic complexity, and community. It's important for participants to understand the specific rules and scoring systems of the DFS platform they're using to optimize their strategies and improve their chances of success.
What is the Average DFS Score?
The Average Daily Fantasy Sports (DFS) Score is a metric that consolidates the daily player performance projections across the four aforementioned fantasy hockey providers. This score is calculated by averaging the points that a player earns in each of these platforms' respective scoring systems. By creating this unified metric, enthusiasts, analysts, and fantasy players have a more holistic and platform-agnostic view of a player's performance projections and value in the fantasy hockey landscape.
Each fantasy hockey provider has its scoring system, which can significantly impact player valuations. For instance, DraftKings awards points for shots on goal and blocked shots, while FanDuel might emphasize goals and assists more heavily. FanDraft and Yahoo might have their unique twists, like bonuses for short-handed points or winning faceoffs. These discrepancies mean a player could be a star in one system but average in another.
The necessity of an Average DFS Score arises from these discrepancies. By averaging the scores from all major platforms, the Average DFS Score provides a more balanced and comprehensive view of a player's abilities and contributions. It dilutes the bias inherent in any single platform's scoring system, offering a clearer picture of a player's overall performance in the fantasy hockey realm.
To calculate the Average DFS Score, one must first understand and compile the scoring rules of each platform. Then, player performance data is collected from each platform for a given period, and their points are calculated according to each platform's rules. Finally, these points are averaged to derive the player's Average DFS Score. This process may involve data normalization to ensure that the scores are comparable and meaningful when averaged.
The benefit of having the Average DFS Score is as follows:
- Platform Agnostic Analysis: It allows analysts and players to evaluate performance independently of the platform, making it easier to identify consistently high-performing players across the entire fantasy hockey landscape.
- Enhanced Player Evaluation: By averaging scores from multiple platforms, the Average DFS Score smooths out anomalies and highlights players who are truly versatile and valuable in fantasy terms, regardless of the scoring system.
- Strategic Insights: Players and managers can use this score to make more informed decisions when drafting or trading players, as it provides a more robust and reliable measure of player value.
- Market Trends: The Average DFS Score can indicate how player valuations are changing over time across platforms, offering insights into market trends and public perception.
- Performance Benchmarking: This score serves as a benchmark for comparing players, helping to identify under- or over-valued players in specific platforms or scoring systems.
Keep in mind that while the Average DFS Score is a valuable metric, it's not without its challenges. The method of averaging must be carefully considered to ensure it fairly represents performance across different scoring systems. Analysts must also account for factors like player injuries, trades, and game lineups, which can affect player availability and performance.
The Average DFS Score in fantasy hockey is a valuable metric for understanding and evaluating player performance across different fantasy platforms. By providing a more holistic view of a player's value, it aids in more strategic decision-making and enhances the fantasy hockey experience. As the fantasy sports industry continues to grow, such metrics will become increasingly important for competitive success and deeper engagement with the sport.
How do You Use the Average DFS Score with other Hockey Stats?
To explore the relationship between different hockey stats and the Average DFS Score, we created a dataset that combined player metadata, DFS Projection scores, the Average DFS Score, and a sample of hockey stats.
The dataset includes the following:
- Player Metadata: Name, Player ID, Team Abbreviation, Game ID, Away Team, and Home Team
- DFS Projections: DraftKing, FanDuel, FanDraft, Yahoo.
- Average DFS Score: Average across the DFS Projection scores from the four platforms above.
- Hockey Stats (Raw): Games Played, Goals, Assists, Penalties in Minutes, Fights, Shifts, and Time on Ice
We ran three high-level analyses to explore the relationship between the Average DFS Score and a sample of hockey stats:
- An exploratory data analysis (EDA);
- A correlation analysis; and
- A scatter plot analysis.
Exploratory Data Analysis (EDA)
We opted for a shorter EDA made up of a summary of the descriptive statistics, a ranked view of the top DFS players, and the distribution of those same players.
Descriptive Statistics
Below are a few key highlights on the descriptive statistics:
- DFS Scores (DraftKings, FanDuel, FanDraft, Yahoo Points): Vary in distribution with DraftKings points ranging from 4.1 to 86.6, FanDuel points from 4.8 to 103.6, FanDraft from 0 to 104, and Yahoo from 2.7 to 69.6.
- Average DFS Score: Ranges from 4.2 to 90.95 with a mean of 12.09. Below is a snapshot of the quartiles, or Interquartile Range (IQR), across the Average DFS Score.
| Min | 1st Quart. | 2nd Quart. | Mean | 3rd Quart. | Max. |
|---|---|---|---|---|---|
| 4.20 | 4.48 | 7.35 | 12.09 | 15.90 | 90.95 |
- Distribution of Average DFS Score Column: The Average DFS Score has a mean of 12.09 and a standard deviation of 10.76, ranging from 4.2 to 90.95. The distribution is right-skewed, with most players scoring lower on average and a few high-scoring outliers.
- Games Played, Goals, Assists, Points: Show variability in player performance with a wide range of values.
- PIM (Penalty in Minutes), Fights, Shifts, Time on Ice: Provide additional insights into player activities during games.
- Outlier Detection: Outliers would typically be detected through methods like the Interquartile Range (IQR), which we've included in the below visualization.
When plotted using a boxplot, you can see that the bulk of the Average DFS Scores are in the first two quartiles.
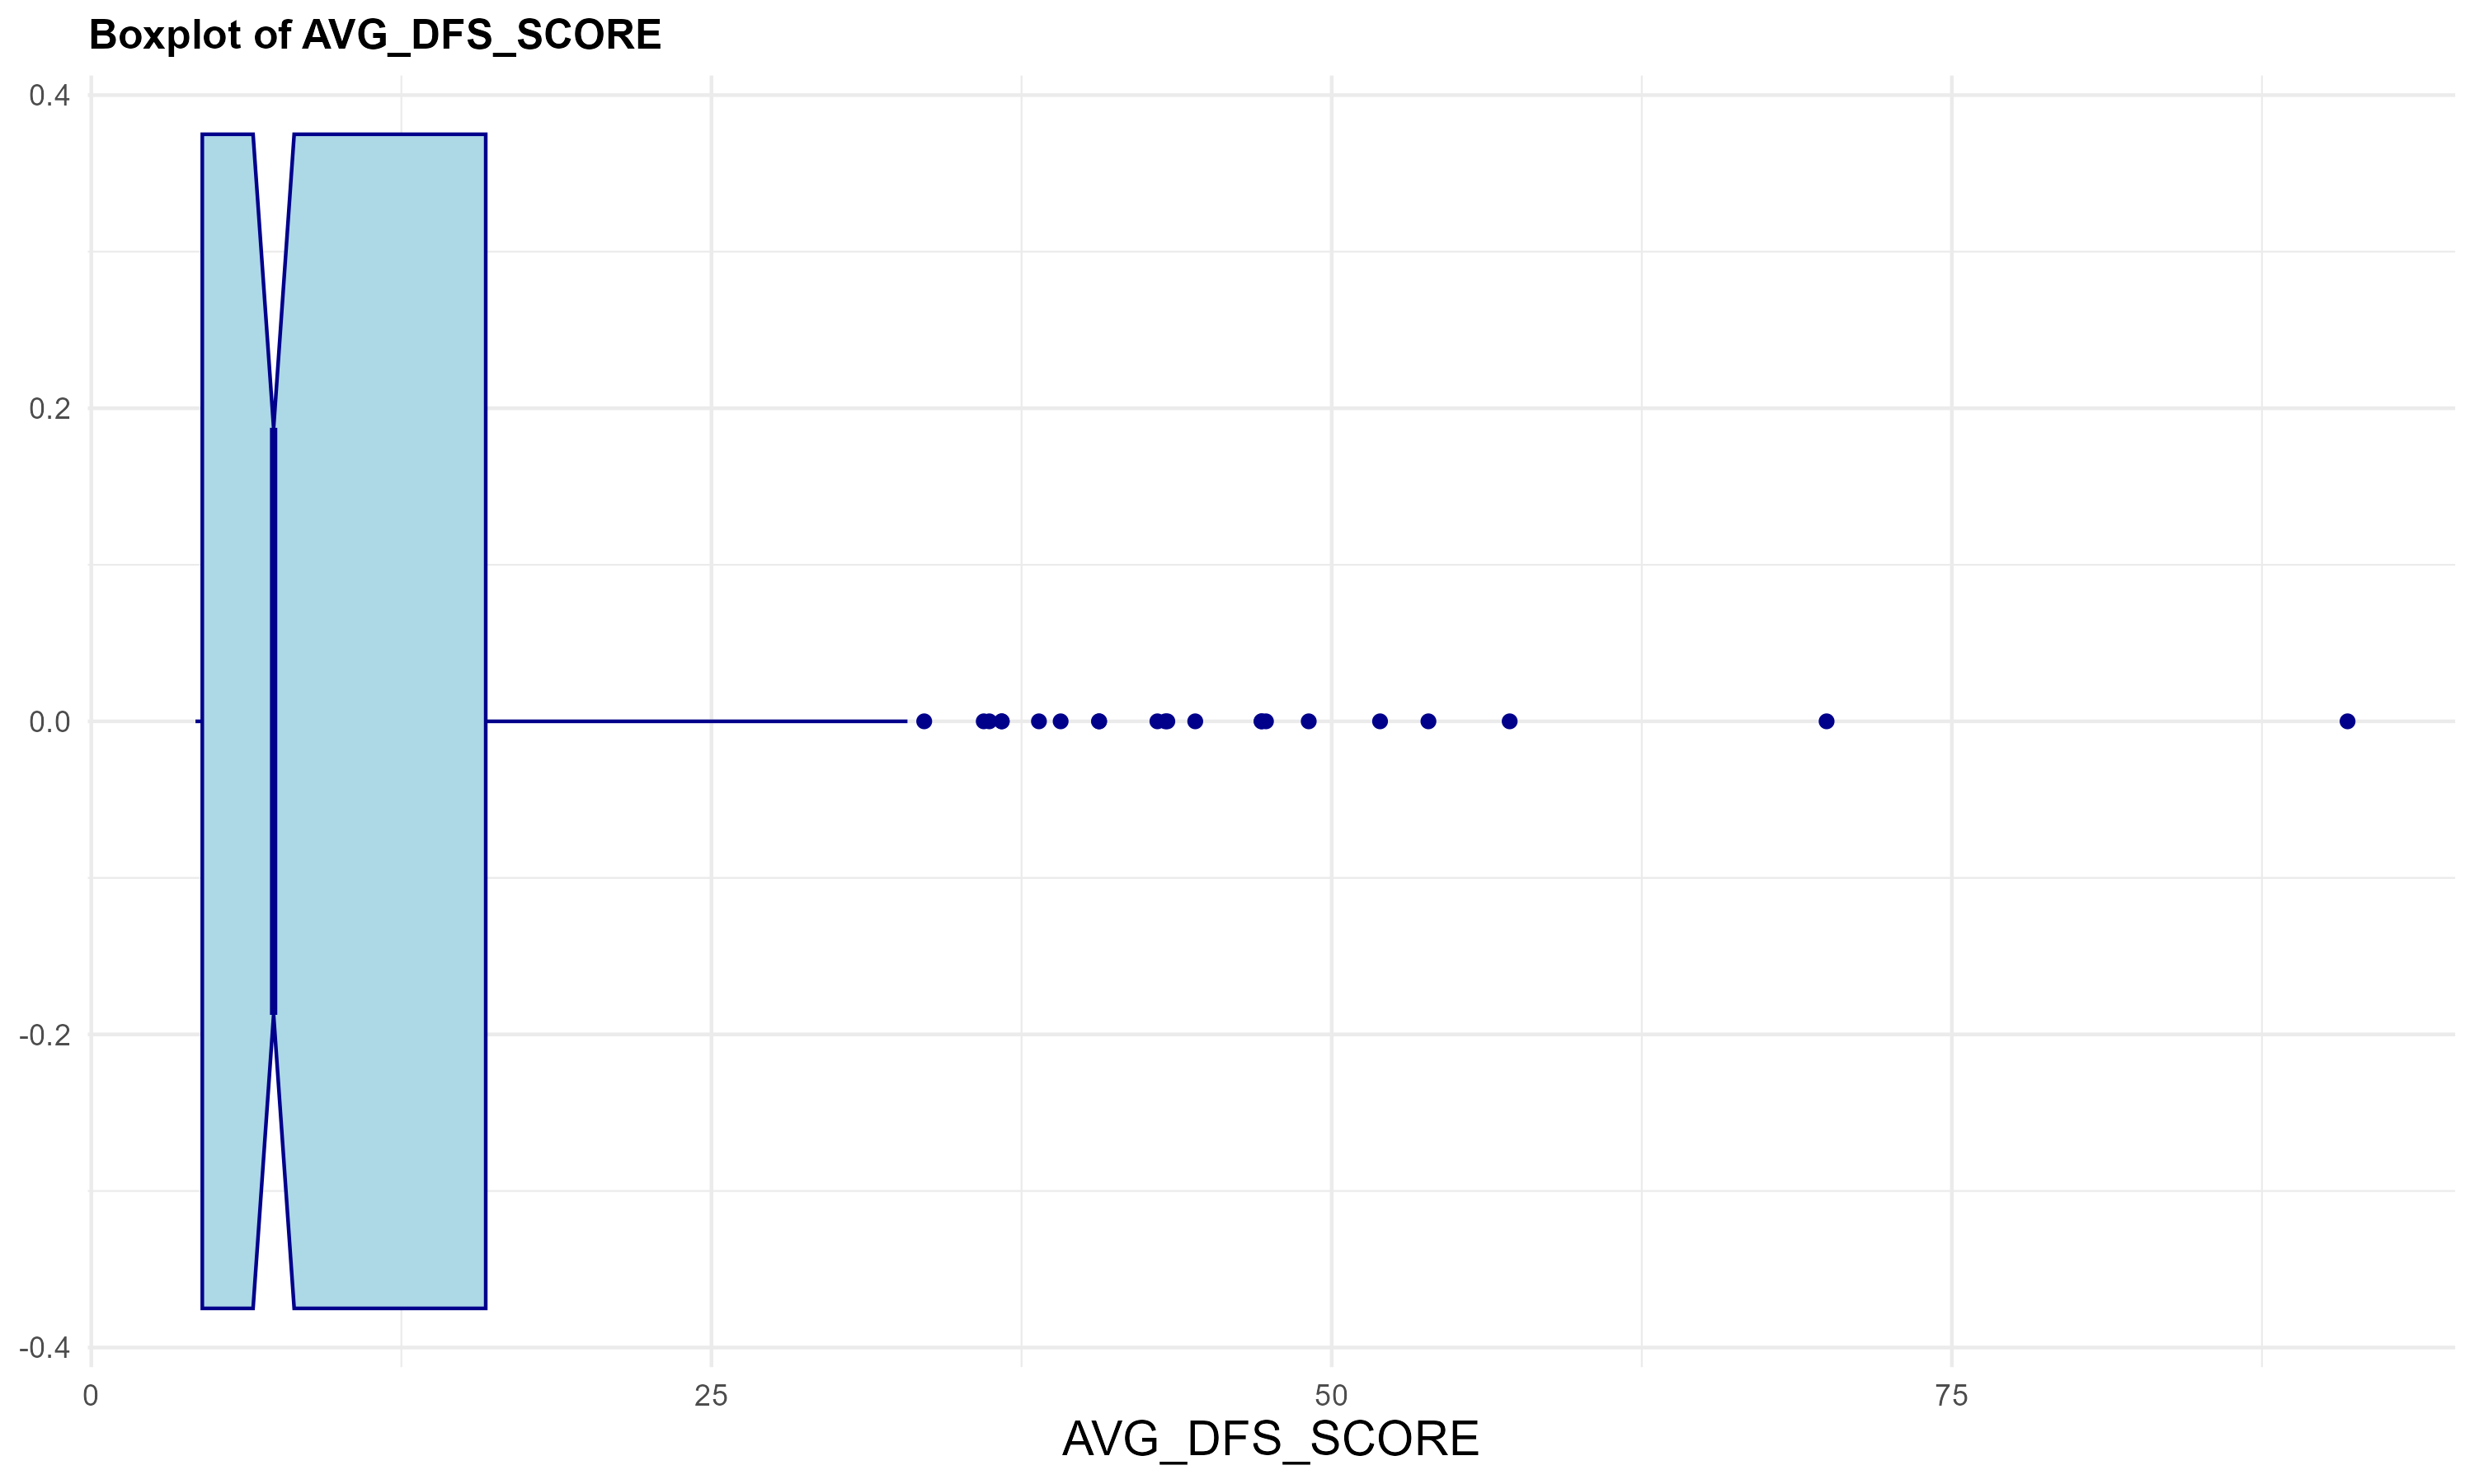
Not surprisingly, the distribution has a right-tailed skew to it, per the chart below.
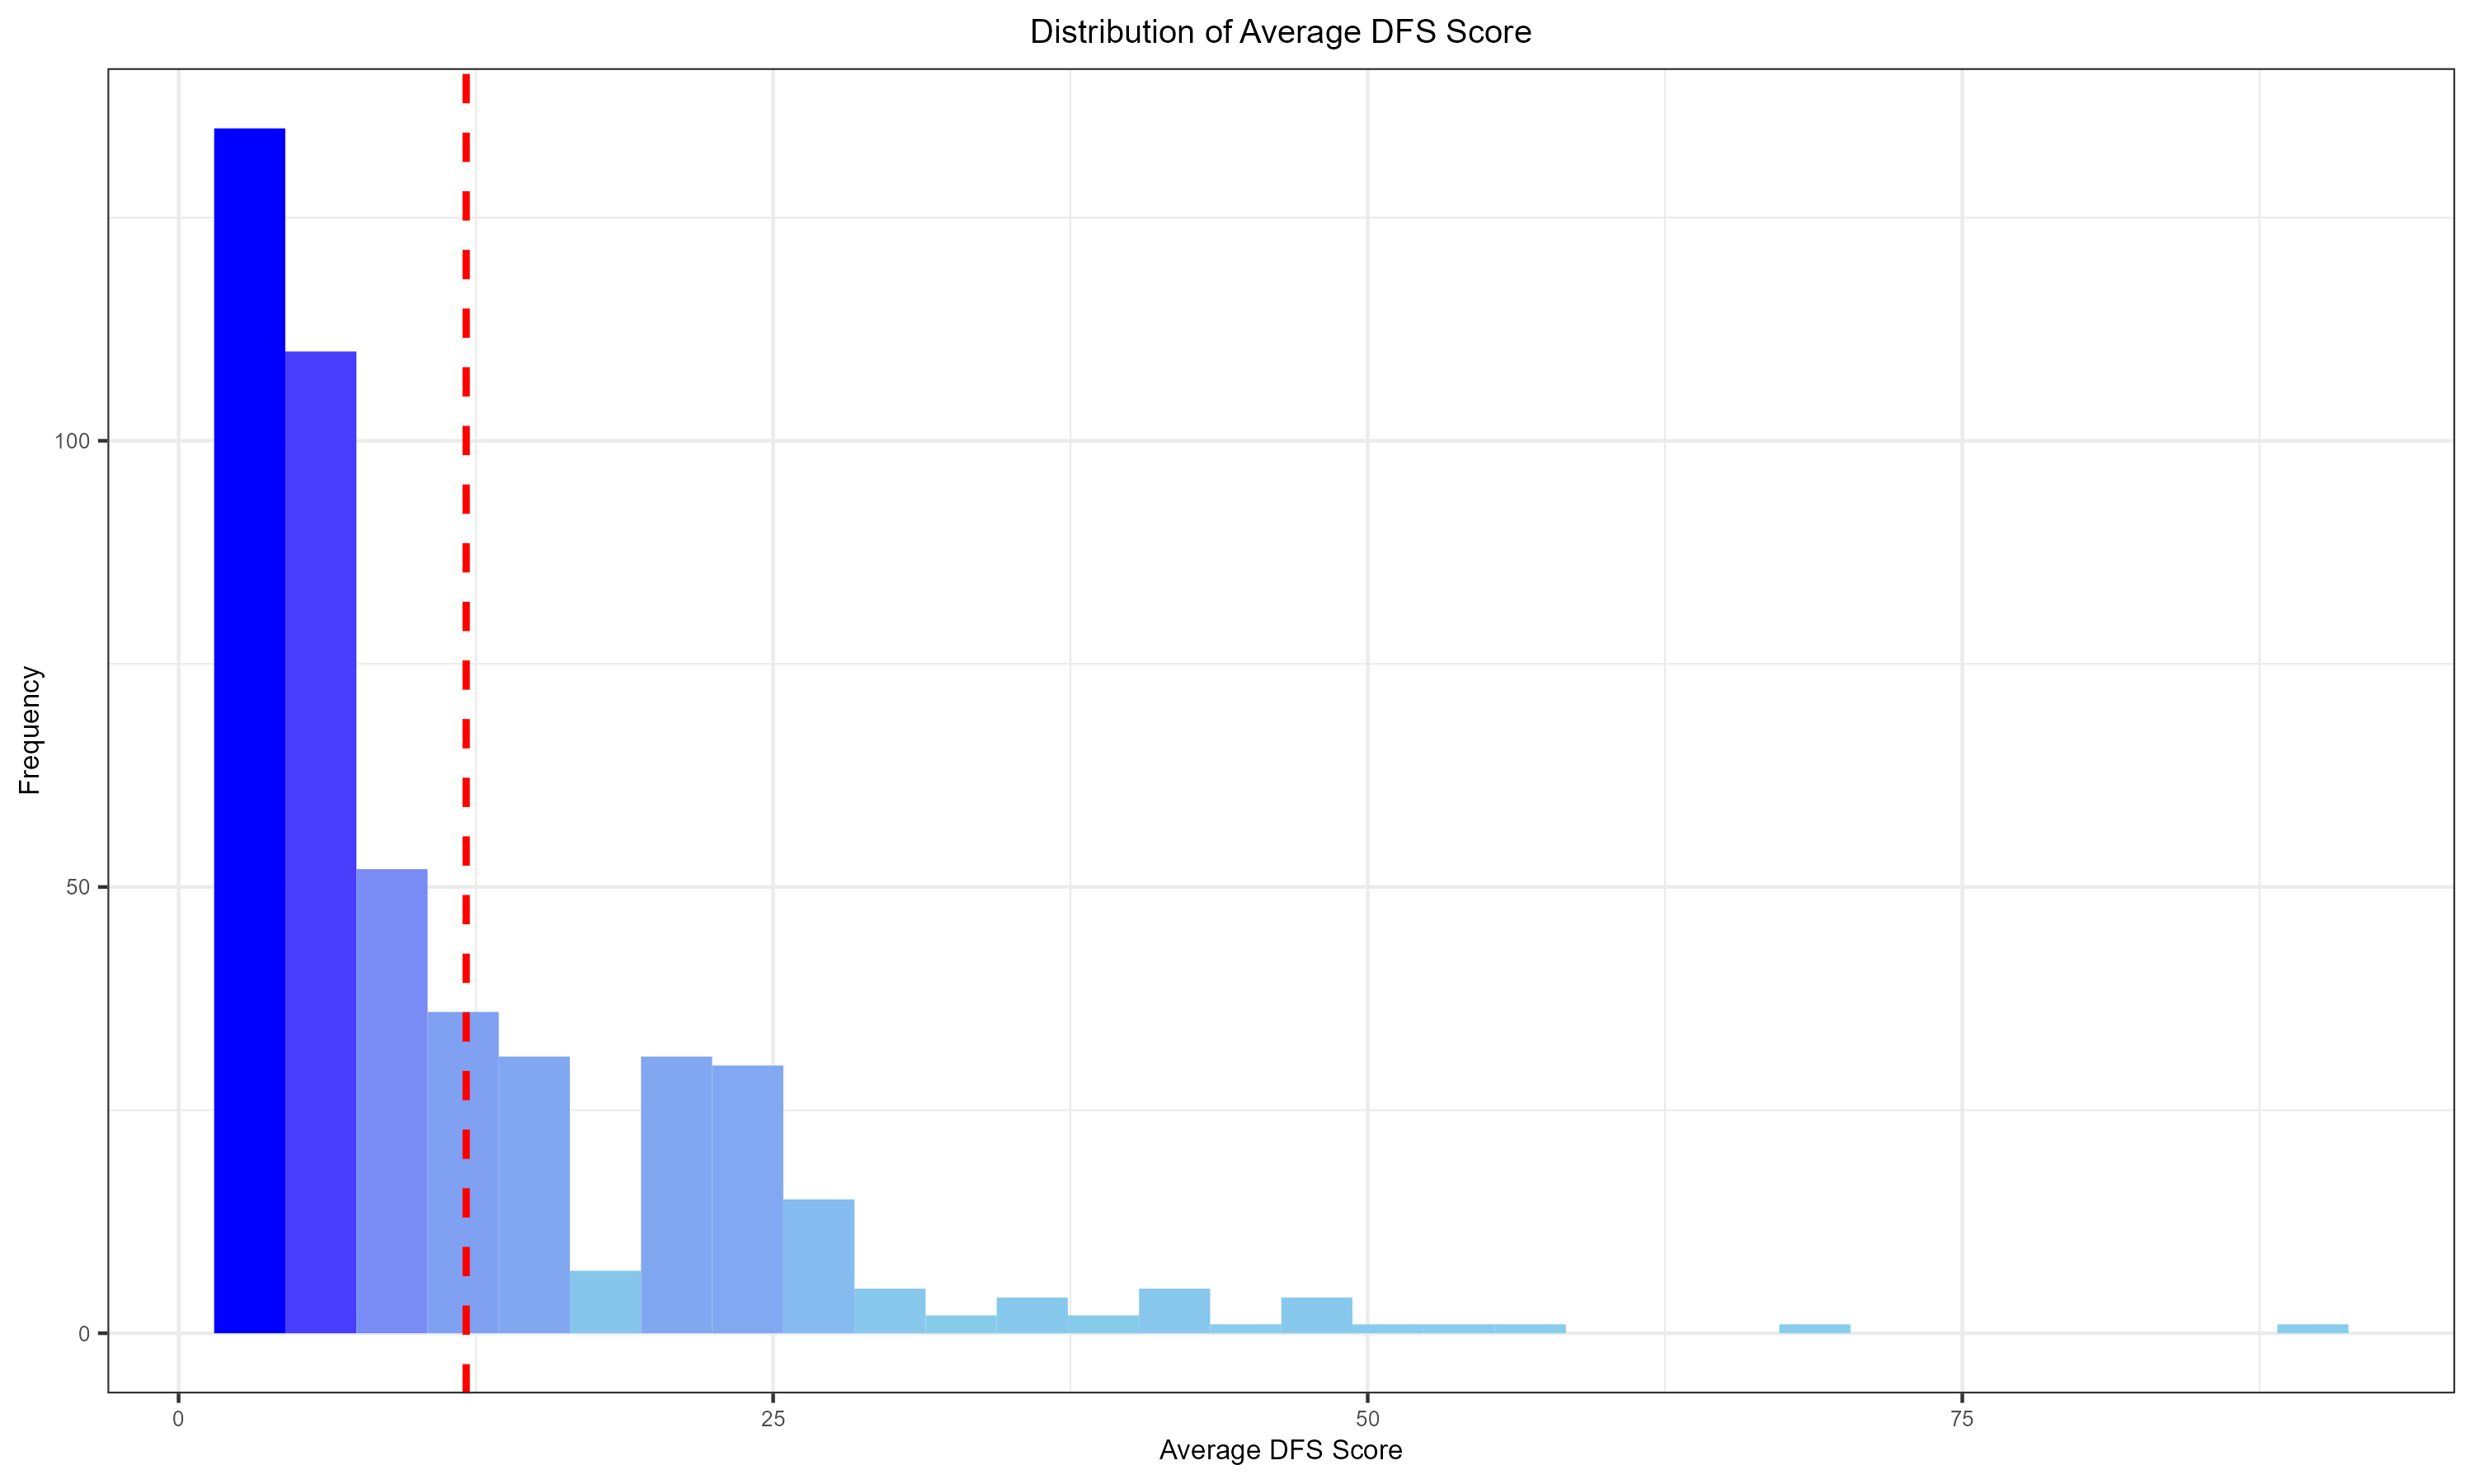
The above includes all records from the daily snapshot – 475 rows. When you filter the data to only contain Average DFS Scores greater than 30 (24 rows), the skew shifts a bit, but you get a close-up of the higher-ranking DFS scores.
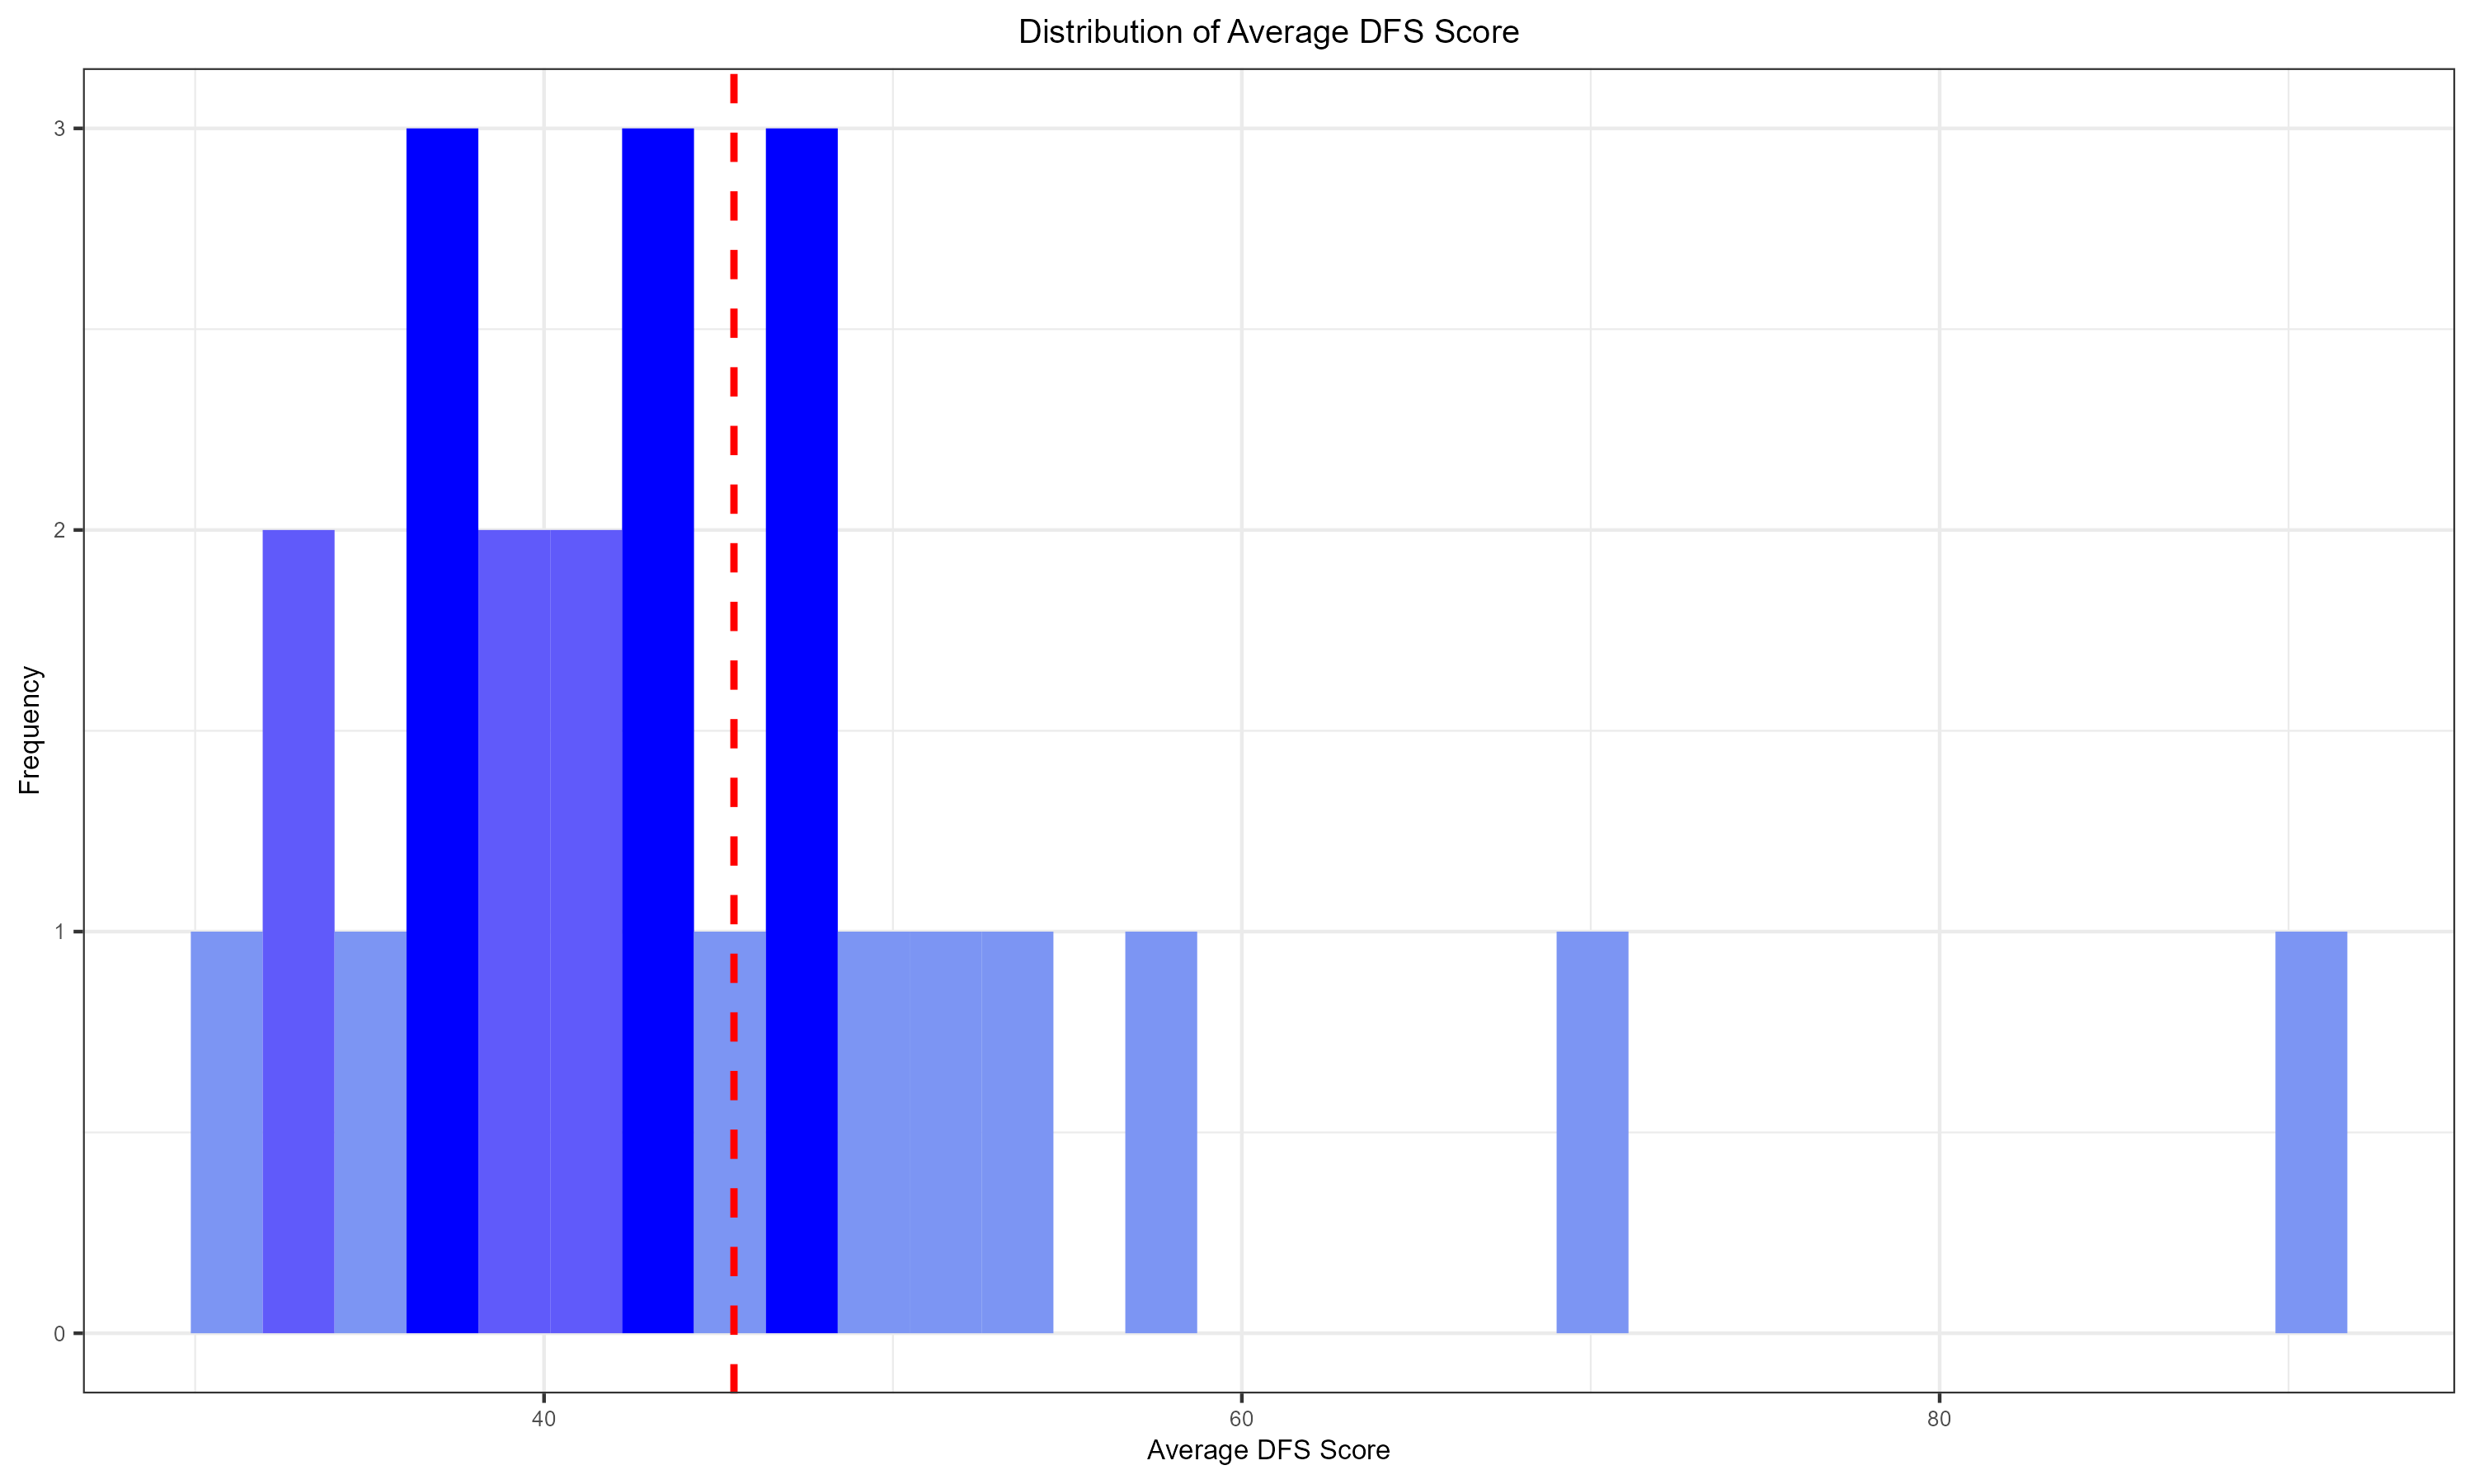
Finally, below is a ranked view of those players (from the daily snapshot) that are greater than 30. This filters on the Player Name and the Average DFS Score and provides a more presentable view.
Correlation Analysis
The correlation analysis takes all of the data in the dataset and creates a correlation matrix plot. The below was the result of this plot.
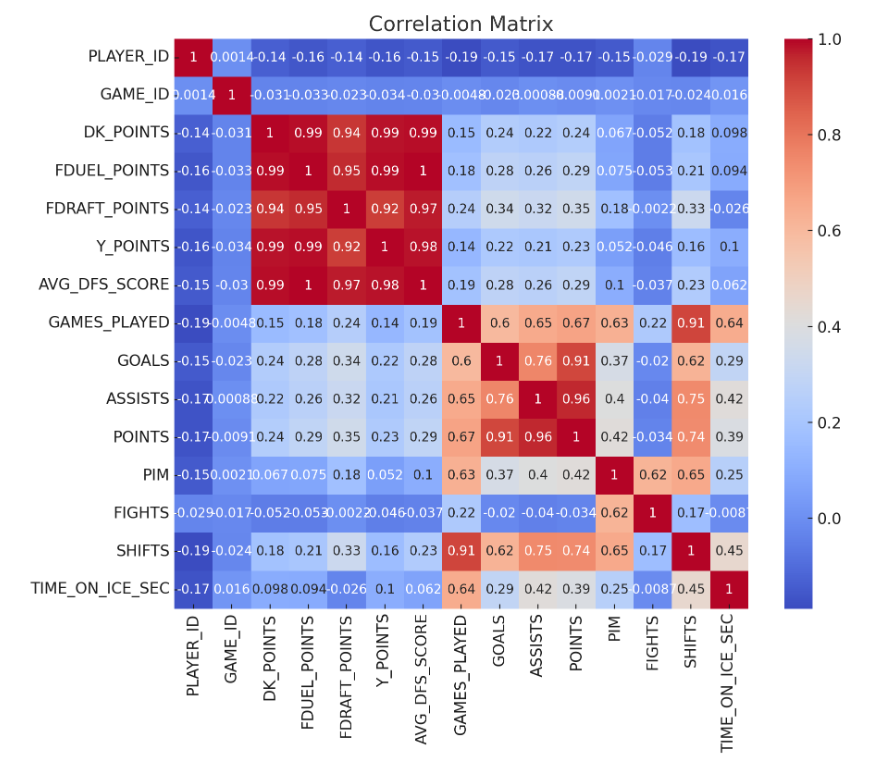
The correlation analysis indicates that Average DFS Score (AVG_DFS_SCORE) is strongly correlated with the fantasy points from various platforms, which is expected since these scores are components of the AVG_DFS_SCORE calculation. The correlations are very high, ranging from 0.97 to 0.99.
For the player performance metrics:
- POINTS, GOALS and ASSISTS have a positive correlation with AVG_DFS_SCORE, albeit much weaker than the fantasy points correlations, with POINTS having the highest correlation among them (around 0.29).
- Other factors like SHIFTS, GAMES_PLAYED, and PIM (Penalties in Minutes) also show positive correlations but are even less pronounced.
- TIME_ON_ICE_SEC has a very low positive correlation with AVG_DFS_SCORE .
- There are some negative correlations observed with PLAYER_ID and FIGHTS, but these are likely non-causal and reflect other factors at play.
This analysis indicates that while fantasy points are directly tied to the average DFS score, player performance metrics like goals, assists, and points contribute to their DFS performance, albeit to a lesser extent.
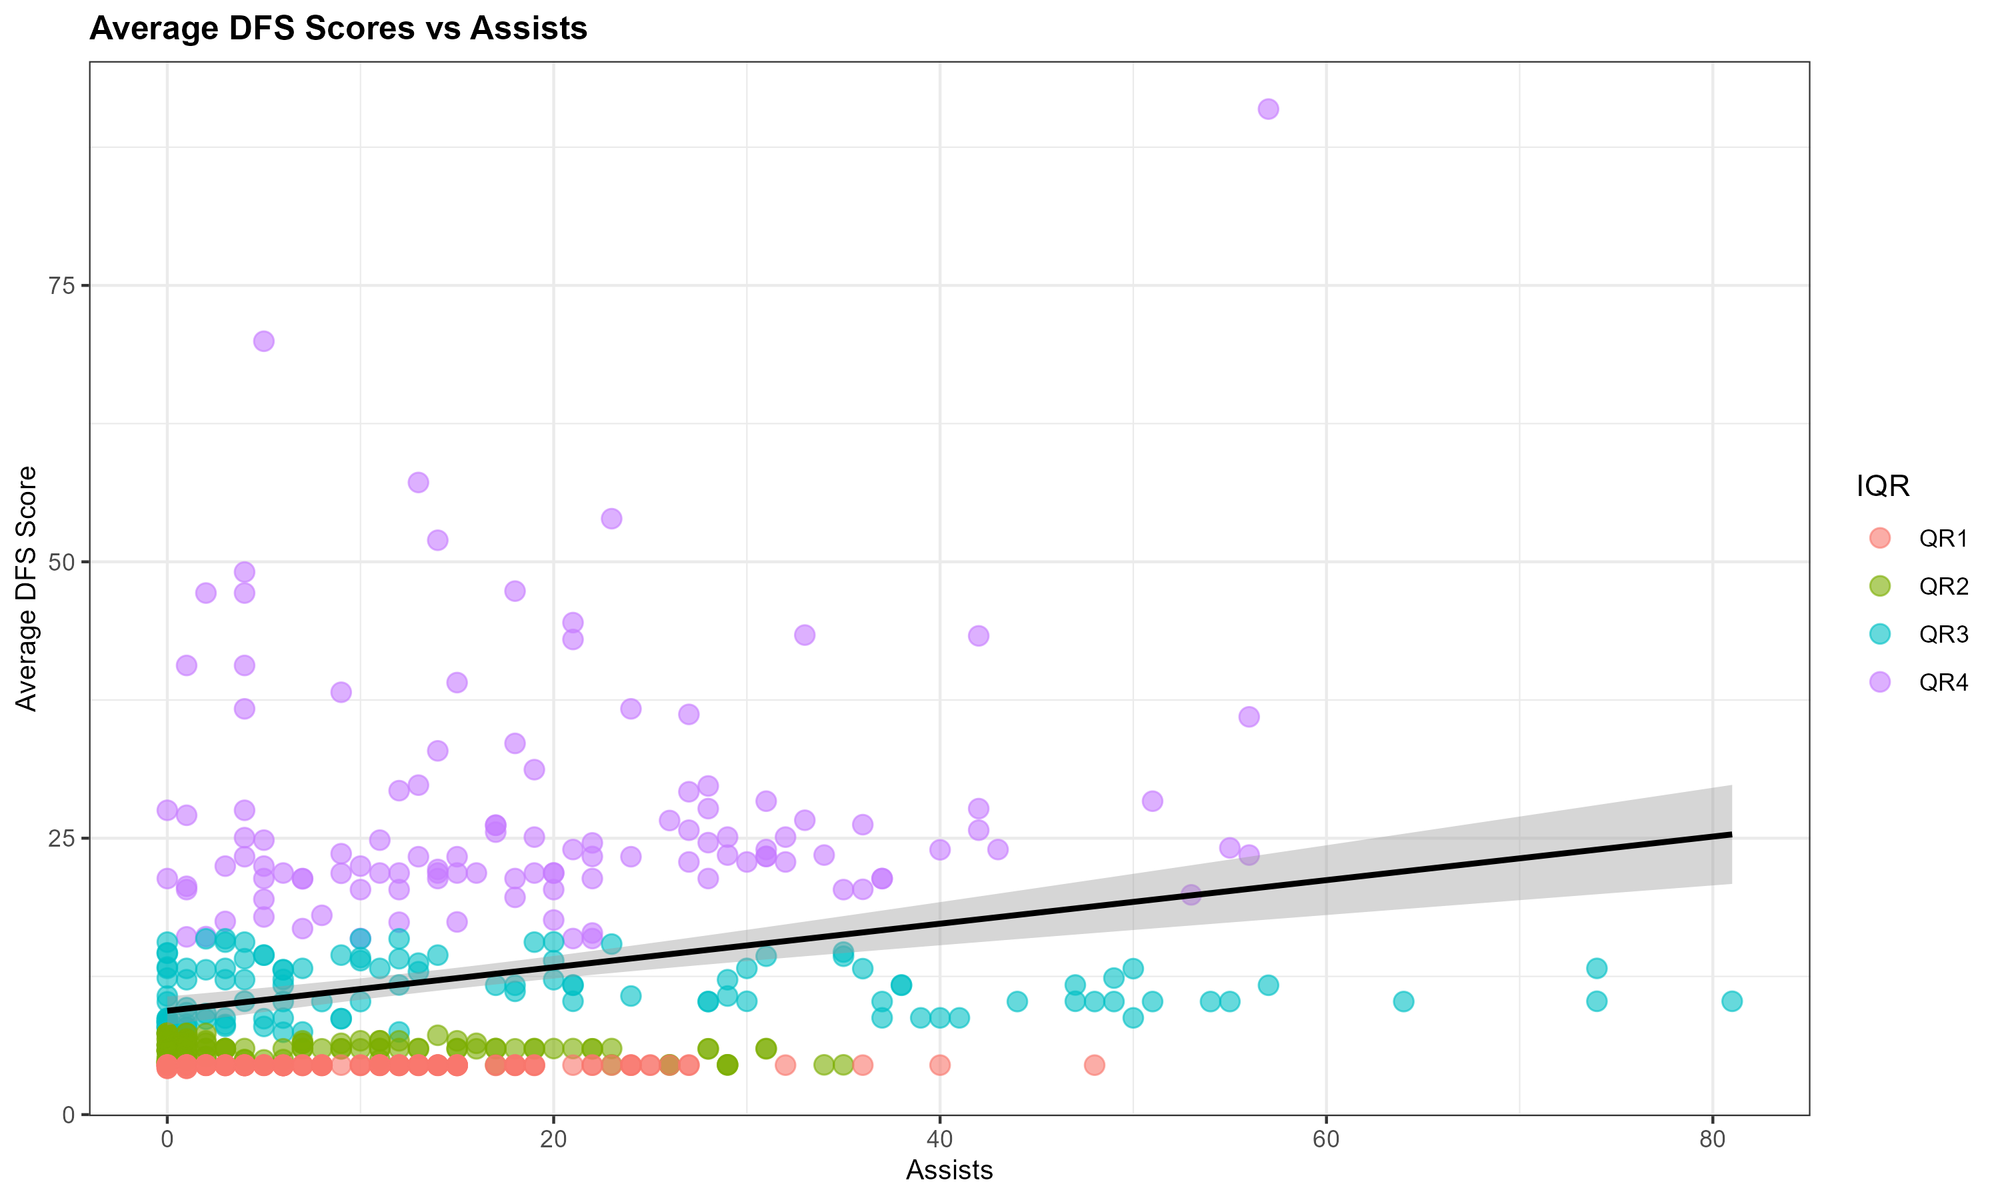
Scatter Plot Analysis
Given the results of the correlation analysis, we explored the correlation between three hockey stats (Assists, Goals and Points) and Average DFS Score. While the correlations were moderately positive, through a scatter plot we can get a better sense for the spread of the data and its position with respect to the trendline.
As expected, the shape of the three scatter plots was similar. However, we included the IQR and then created four color classes using the IQR. This gives the visualization a bit more life by calling out the larger values (and outliers) that are in QR4 (quartile 4). This is represented by the right-most values in the distribution visualization shown earlier. Outliers (data points way outside of the mean and trendline and located in the upper right-hand quadrant of the visualization – high Average DFS Score and large number of Assists) can represent interesting stories, and in this case we find Cale Makar as the outlier for Assists in this scatter plot.
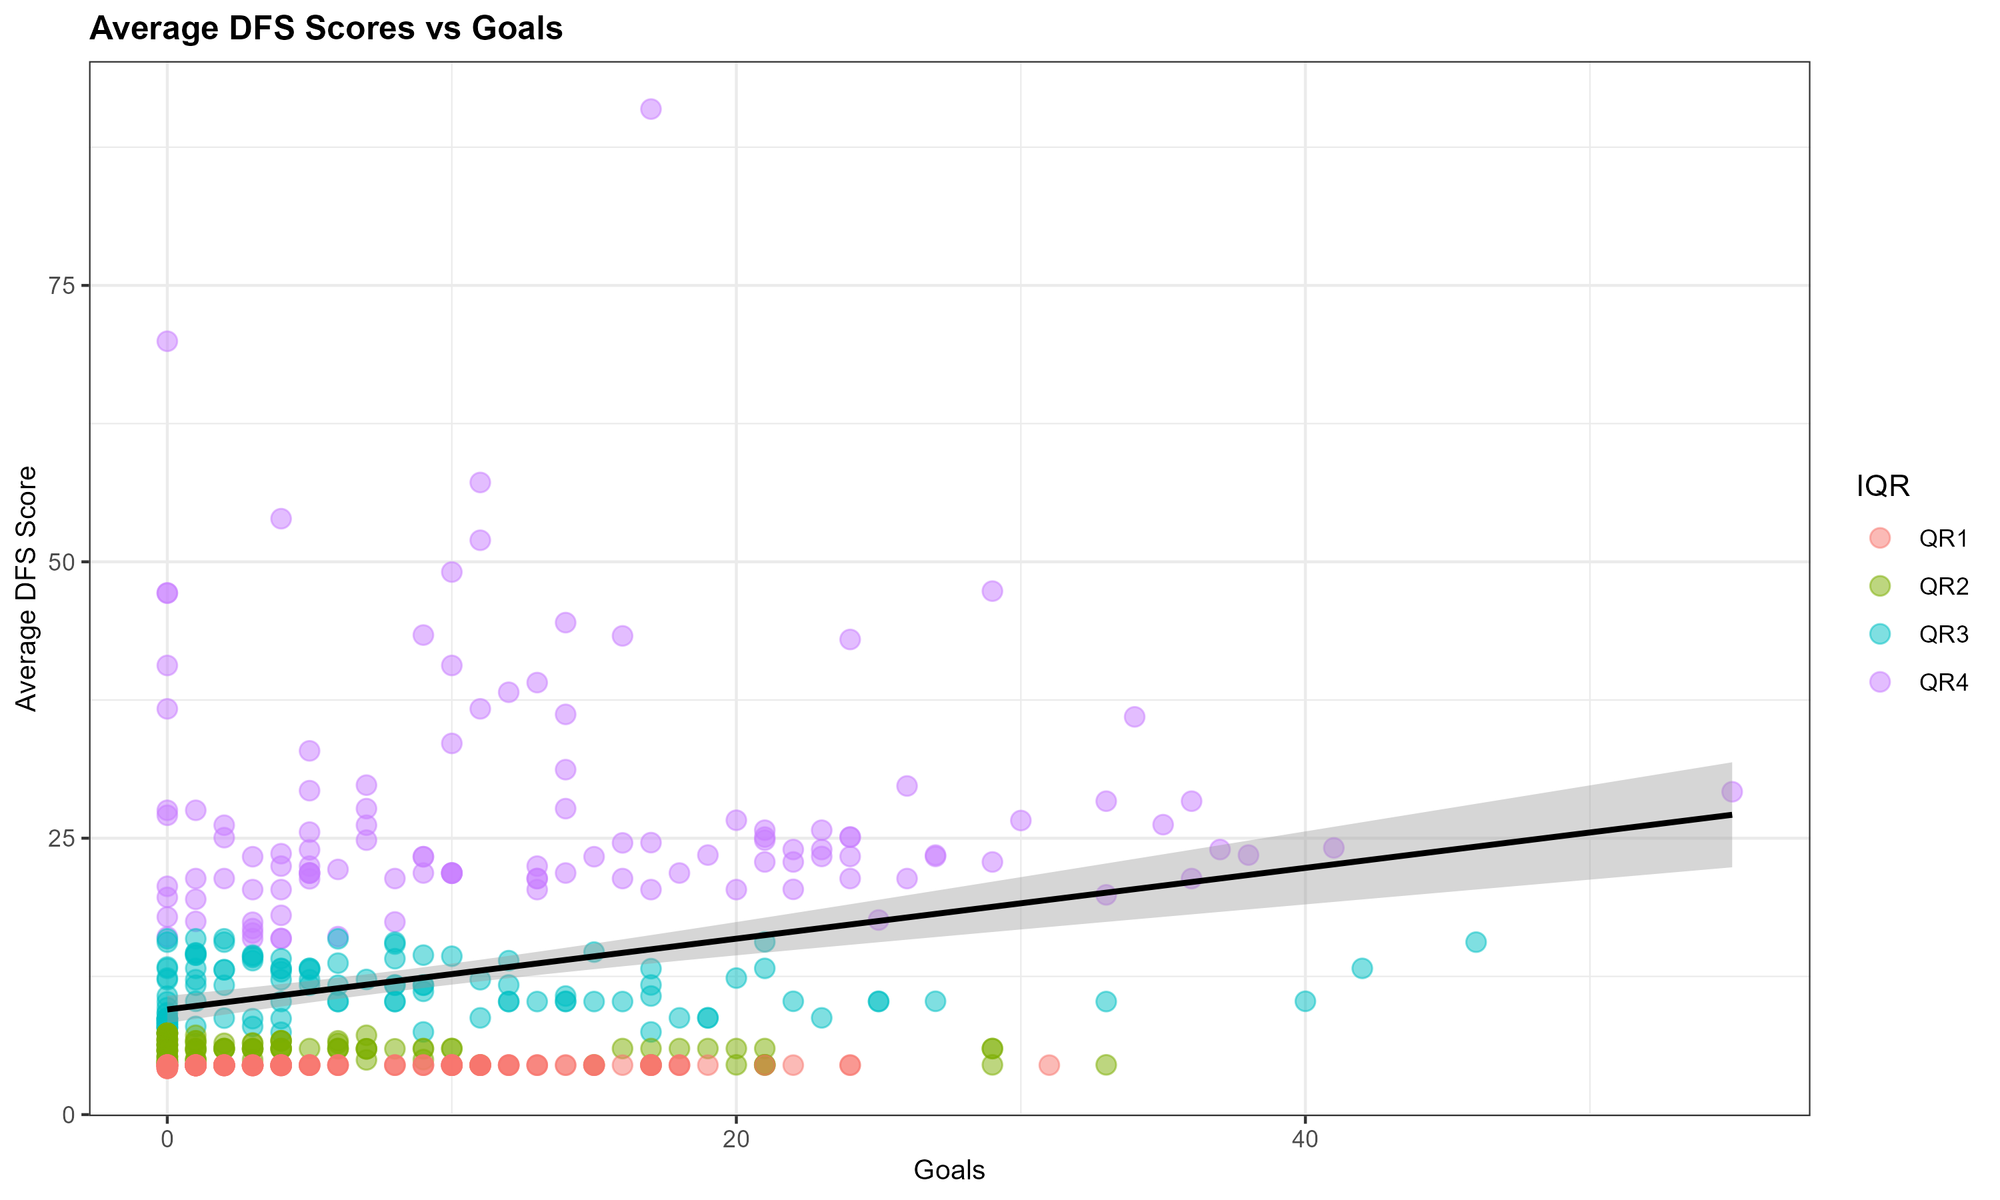
When we evaluate the Average DFS Scores vs Goals, we again see Cale Makar (somewhat) as an outlier – with a high Average DFS Score and a high number of goals for a defenseman. This is pretty impressive, showing he is an offensive defenseman.
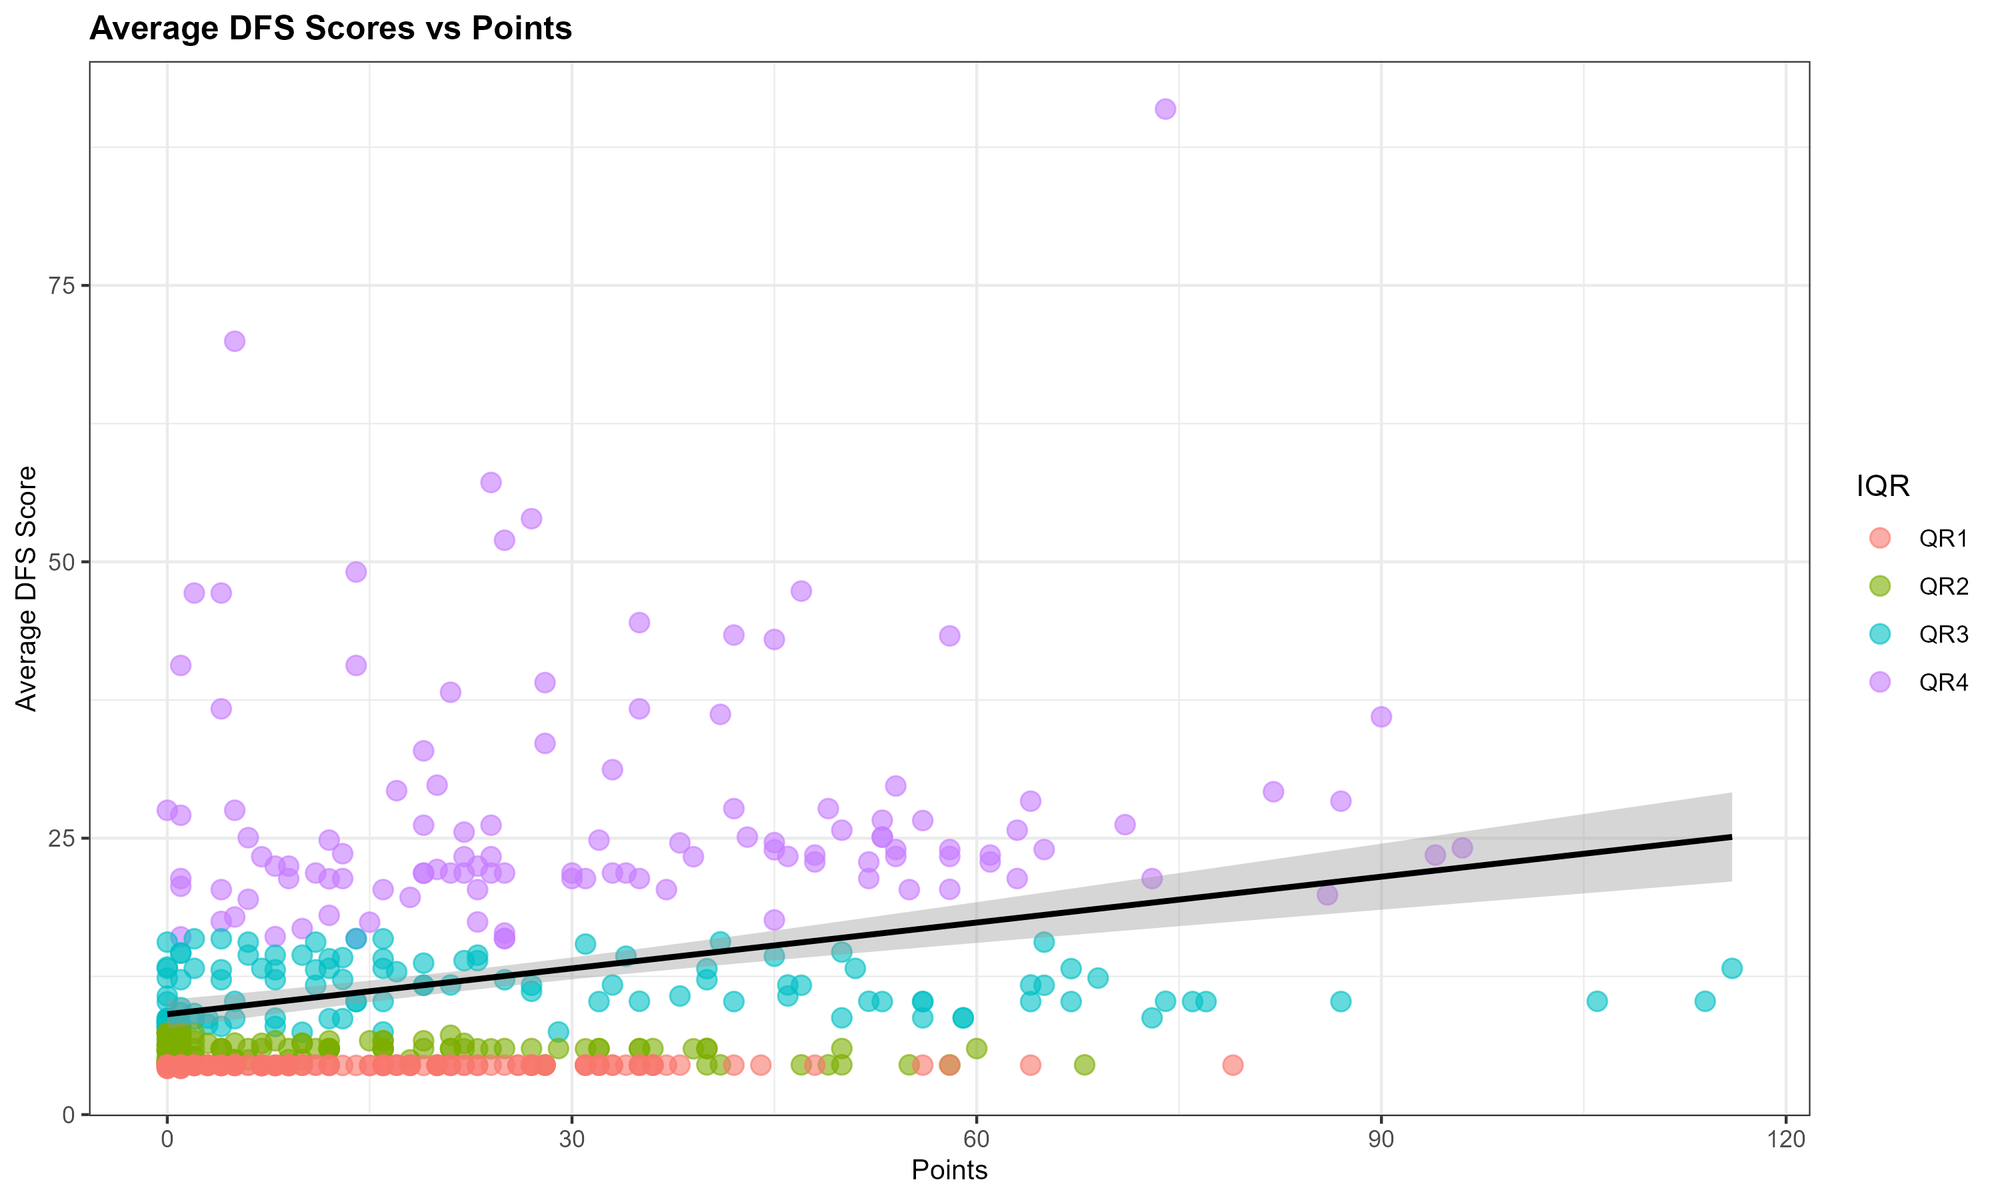
Unsurprisingly, the Average DFS Score vs Points again shows Cale Makar as an outlier.
From here, two potential pivots are possible:
- You can make DFS decisions based on outliers (or data points that are outside of the mean and trendline). This would depend on what hockey stat you're measuring. For example, we wouldn't recommend choosing an outlier for Points when you need someone for Blocked Shots. So, create your analyses carefully considering the hockey stats for your DFS platform and player/team needs.
- You can create a story or content based on the outlier. While not central for a DFS enthusiast to tell a data-driven story, it is critical for sports journalists, data analysts, data scientists, and the like to be able to tell a good story – for example, more content creators are engaging in fantasy hockey content. So, outliers are great places to look for interesting stories. (Our final section will focus on how to bring a story together using the above analyses.)
For the most up-to-date Average DFS Score vs Points scatter plot (we refresh daily), see the visualization below. Note that in this chart, we've called out the upper right-hand quadrant of the scatter plot, which is where you would find your outliers.
Creating Social Content from DFS Projection Stats
Let's first look at a subset of Cale's statistics, which are roughly 20 points higher than the next player using the Average DFS Score.
| Name | Team | Goals | Assists | Points | Avg. DFS |
| Cale Makar | COL | 17 | 57 | 74 | 90.95 |
When you build your story, you'll want to be thinking about your audience, what they care about, the hook, and so on. There's likely a great story around Cale being a top offensive defenseman or how he'll contribute to their playoff success, but we'll keep it simple and our story will be he's the Top DFS Choice. Bit bland, but we trust that you'll come up with something more spicy.
Our target platform for the story will be Reddit, where the goal will be to post to one of the hockey subreddits – a fun post that celebrates Cale and the Avalanche and calls him out as a potential fantasy hockey pick. Based on the content we create, you could also target Instagram and TikTok.
We use a digital sports imagery site (Icon Sportswire) to get our photos, so we purchase and download 2-3 images that we thought would look good in our post. See below for an example image.

We then take a sample of the hockey stats and DFS platform scores, along with our Average DFS Score and, with our designer's help, build out a great-looking tribute to Cale. The result is below.
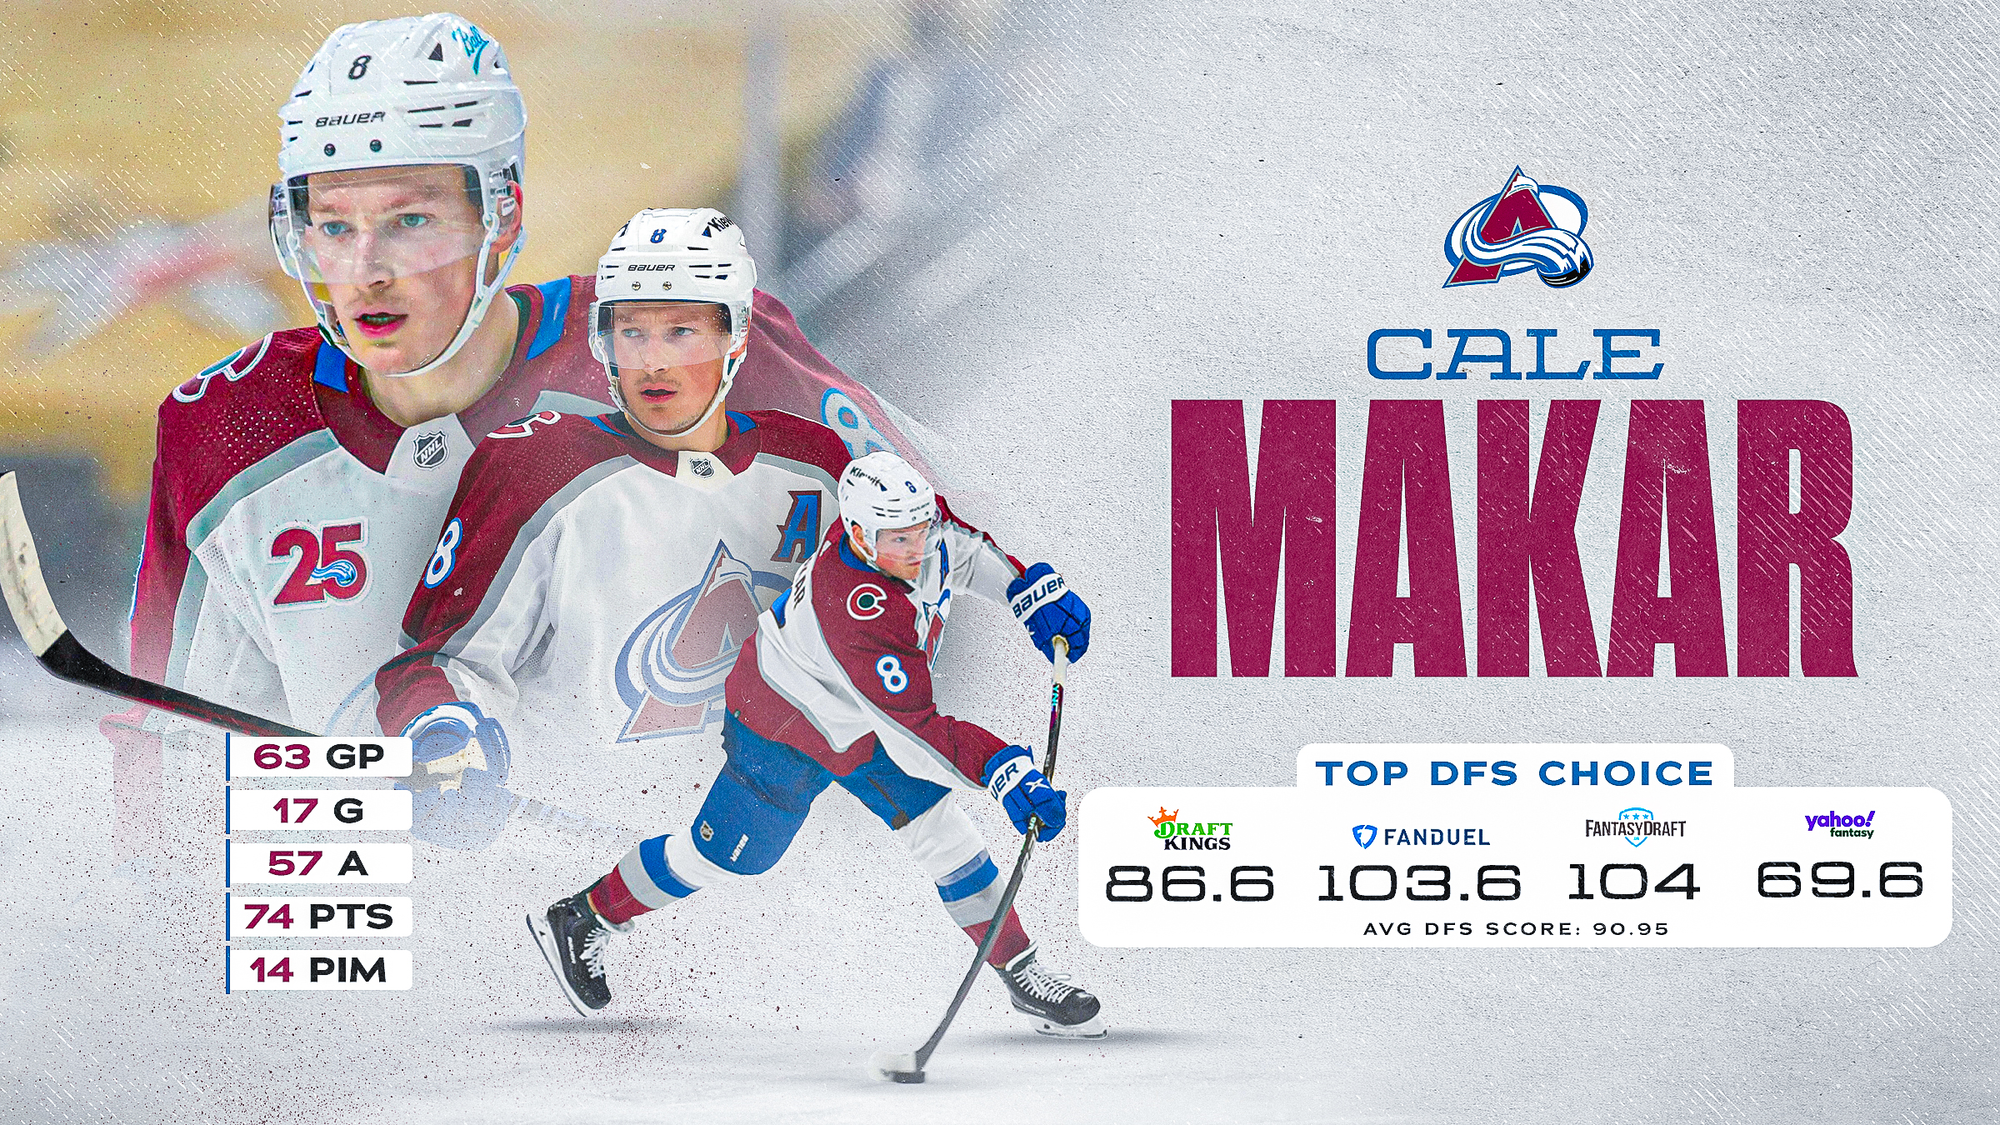
Depending on the type of platform to which you're publishing or the type of story/content you're creating, you'll want to experiment with your design – tailored to your audience and the target platform. But the above shows that with some analytics, an outlier and some design magic you can create a snazzy post for your hockey subreddit.
Summary
In this edition, we created a new metric called the Average DFS Projection Score (or Average DFS Score). The score was calculated by taking the average Projections Score from the four major fantasy hockey platforms and assigning the score at the player level. We then integrated a sample of hockey stats with the Average DFS Score and ran some analyses to explore the relationship between the Average DFS Score and the hockey stats.
We found some of our hockey stats (e.g., Points, Assists, and Goals) had a modest positive correlation with the Average DFS Score. However, when we created a scatter plot to further explore the relationship between each of the hockey stats and the Average DFS Score, we found there were outliers. One in particular we thought was interesting was Cale Makar, an offensive defenseman who plays for the Colorado Avalanche.
We then walked through how to take the outlier, along with the hockey stats and DFS Projection scores, and create some social media content for Reddit – specifically a hockey subreddit where you can post some fun content about Cale being an outlier.
As a follow-on exercise, we'd recommend doing some of your own analyses using DFS Projections data and hockey stats. Perhaps you can find some outliers of interest and need for either your fantasy hockey picks or your next social media post!
Subscribe to our newsletter to get the latest and greatest content on all things hockey analytics!
Member discussion