Composite Metrics: Direction, Not Destination
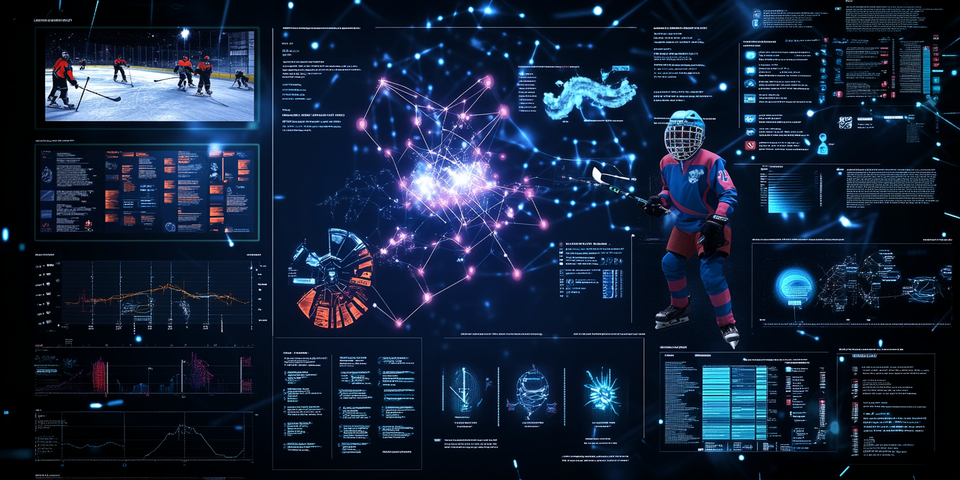
We introduced the Team Balance Index (TBI), a novelty metric we're exploring to see if we can get better summaries of team performance this season.
When we build composite metrics like the TBI, the temptation is to treat them as final answers. But TBI isn’t a crystal ball — it’s a compass.
Every composite metric blends multiple signals into a single number – which invariably acts as a summary metric. The purpose isn’t precision; it’s perspective. For hockey, TBI pulls together offense, defense, goaltending, and grit to ask a simple question: is this team’s performance balanced or lopsided?
Join the Data Punk community to learn how to build your own stories through predictive models!
Used well, a composite metric can reveal directional truths. Teams with high TBI scores often show structural stability — they can win in multiple ways. Teams with low TBI scores may rely too heavily on one dimension — a hot goalie, a top line, or power-play luck.
Used poorly, composite metrics become vanity stats — numbers built for dashboards, not decisions.
So the lesson? Use TBI as a flashlight, not a spotlight. It won’t tell you who will win the Cup — but it will show you which teams are built to last.
Be sure to check out our ongoing coverage of composite metrics (and how we're testing them in Power BI and Tableau dashboards) on Data Punk Hockey and on Instagram!
Sign up to get free access to more weekly content and courseware on all things Hockey Analytics.
Member discussion