4 Nations Face-Off: Will Canada Beat the USA?
At a Glance
- Overview of the 4 Nations Face-Off Series
A multi-part series covering the 4 Nations Face-Off tournament - Updates on our Summary Statistics
We refreshed the data and re-calculated our summary stats - Deep Dive on Team Canada
Explores offence, goaltending and experience - This Week's Prediction
Updates our prediction based on new findings and analyses from this week
Overview of the 4 Nations Face-Off Series
This series explores the teams in the 4 Nations Face-Off tournament, with the end goal of predicting who will win the tournament. Our last newsletter focused on Team Sweden: 4 Nations Face-Off: Can Sweden Beat the Odds? If you didn't get a chance to read it and want a quick catch-up, we've packaged it all up in a short video.
You can also find all of the newsletters in this series here.
To predict who will win the tournament, we're analyzing snapshots of player data from the 2024-2025 season through the following context:
- Where the teams are recruiting their players from;
- A deep dive on each nation's team (including offense, goaltending and physicality) to understand strengths and weaknesses; and
- A comparative analysis of the teams to create a predictive model to forecast who will win the tournament.
In this week's edition, we'll focus on Team Canada.
Updates on Our Summary Statistics
From our data pull, we use Goals, Assists, Points, Penalties, PIM, GAA, and Save Percentage to calculate an Overall Predictive Score (OPS). This is a high-level, weighted metric based on offensive, goaltending and physical stats between 0 and 100.
Last week, we took another snapshot of the data and re-calculated the OPS metric to see if any of the teams are making progress. The below was the result.
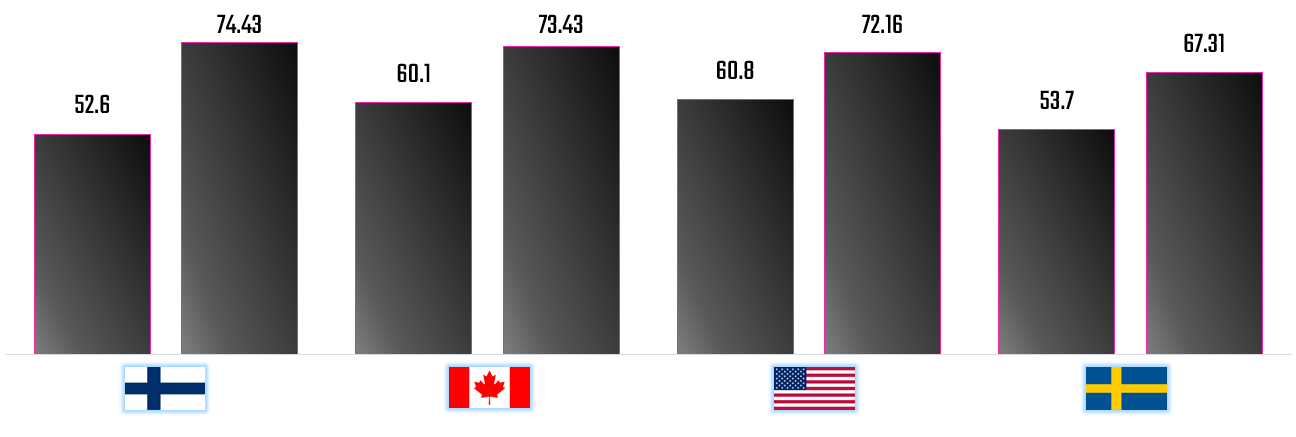
Interestingly:
- Finland made the biggest gains increasing their OPS by 21.6 points.
- Sweden, Canada and the USA followed with 13.6, 13.3 and 11.4 points respectively.
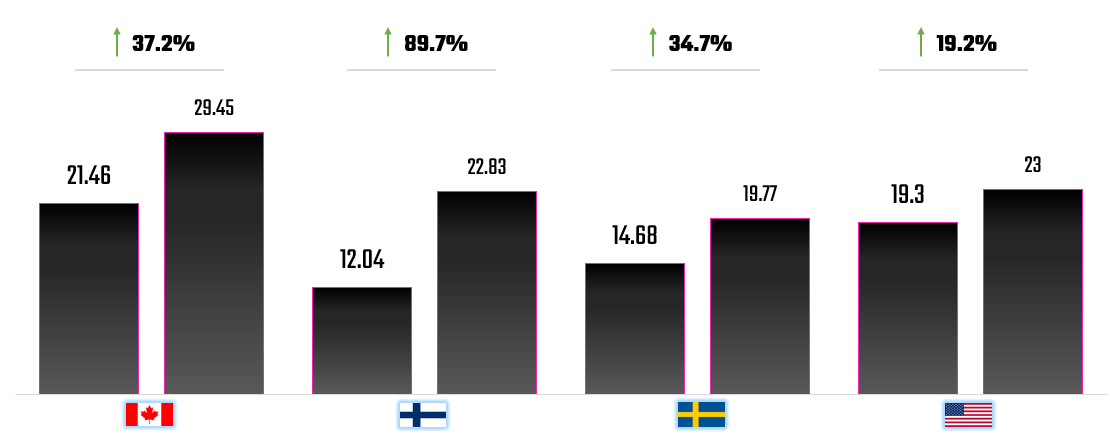
The OPS metric is an abstracted score, so we looked at each team's offense and goaltending to see if we could better isolate the gains (or losses). Below is a view based solely on the average points per nation. Here, it's evident that Finland, again, has bigger gains than the other teams.
While the high-level abstraction is good, below is a more detailed view across Goals, Assists and Points. This gives you a better perspective on where each team is at compared to one another.
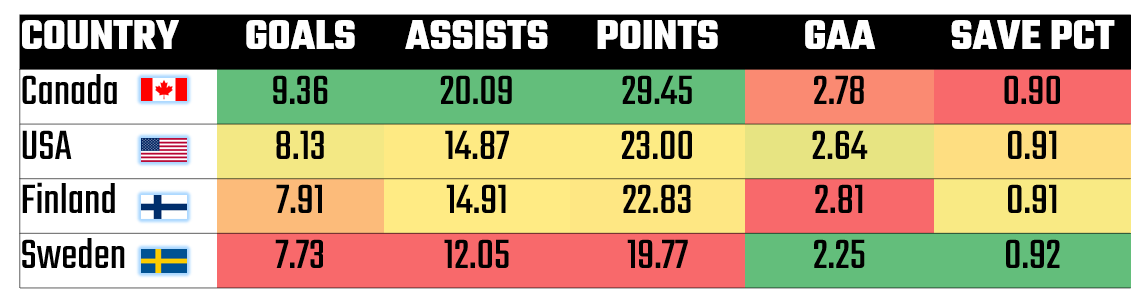
You can also see the goaltending statistics as well, but again it incorporates all of the goalies on the roster. We've broken out and ranked the goalies below. The key differences from our last snapshot are 1) Sweden is more tightly clustered towards the top of the ranking now, 2) the original top-leaning cluster of US goalies have now become more dispersed across the rankings (at the same time Connor Hellebuyck is now in the top spot) and 3) Finland had a mid-level cluster which is now breaking with Juuse Saros moving up in the ranks.
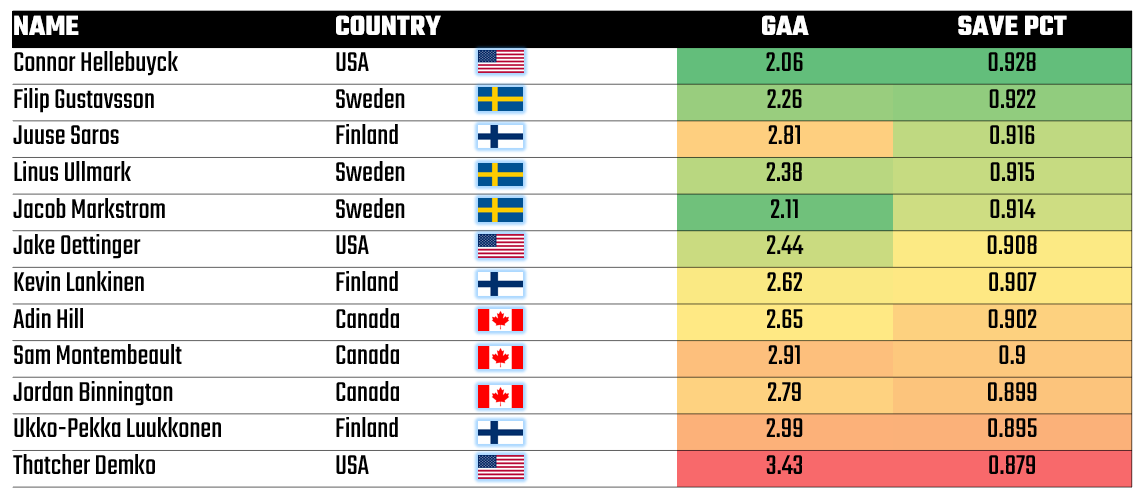
Goaltending, namely Save Percentage, has marginal gains or losses, with Sweden having the only gain across the teams.
Clearly, Canada are the strongest on the offense but less so in front of the net. And while Finland did make big gains in our re-calculation, they're still weaker than Canada.
Deep Dive on Team Canada
As we jumped down the rabbit hole on the data, here's what we discovered about Canada.
- Their point production ranks the highest, supported by both playmaking skills (Assists) and converting on shots (Goals).
- They have an exciting forward line-up, combining both younger and experienced players with superstars.
- Goaltending will be an area that other teams will exploit. They are middle-of-the-pack when compared to the other goalies.
- The OPS metric shows that Canada has broken the ranks from the other teams.
So, what does all this mean?
The numbers show that Canada will be a force to be reckoned with on the forwards with a solid defensive core to support them. They will, however, have to shift their game somewhat to protect where other teams may come after them: their goaltending.
Team Canada Power BI Dashboard
To help with our deep dive on Team Canada, we built a Power BI dashboard. The dashboard comprises three reports:
- Offense – represented through Point Production
- Goaltending – showing GAA and Save Percentage
- Experience & Point Production – showing the relationship between Age and Points
Let's jump in!
Offense
In the first report, we have two Slicer controls and two Line and stacked column charts. The Slicer controls filter specific positions and players. The Line and stacked column charts visualize Points for specific players, along with Goals and Assists. The second chart shows Age versus Points.
Here, we can see that Canada has a strong team that is heavy on playmaking and production. Further, they have a good complement of players and some serious staying power in their offense. Before you even get to Connor McDavid, you have Mark Stone and Mitch Marner who are solid point-producing players.
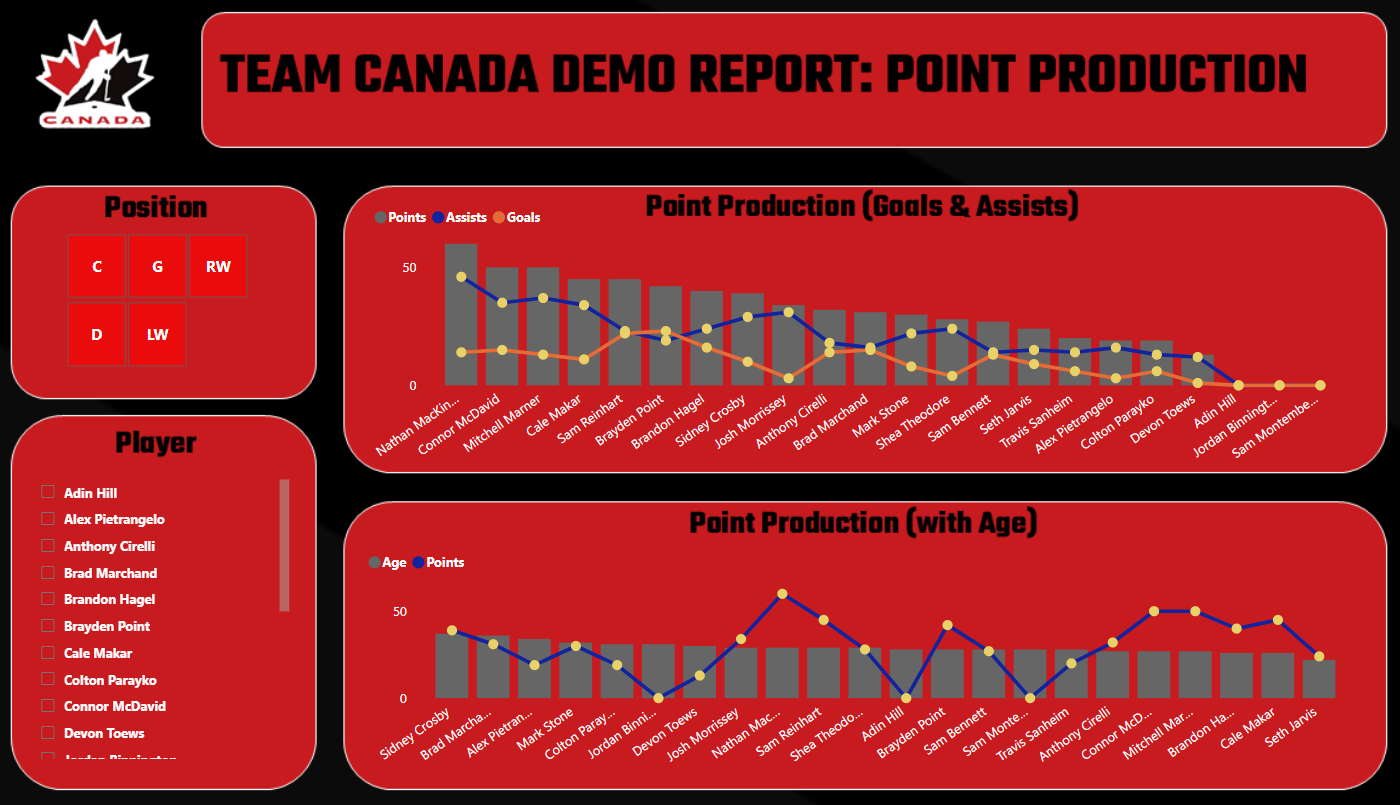
And lastly, they have Sidney Crosby, Nathan MacKinnon, and Connor McDavid as league leaders, who will bring maturity and experience into the dressing room and on the ice.
This team is going to be a lot of fun to watch.
Goaltending
The second report includes a Slicer control and two Line and stacked column charts. The Slicer filters goalies, and the two charts measure Age versus GAA and Age versus Save Percentage.
As you saw earlier, Team Canada's goaltending is in the middle. However, it's not like they don't have any experience. For example, Adin Hill is a Stanley Cup winning goalie (Vegas Golden Knights) as is Jordan Binnington (St. Louis Blues).
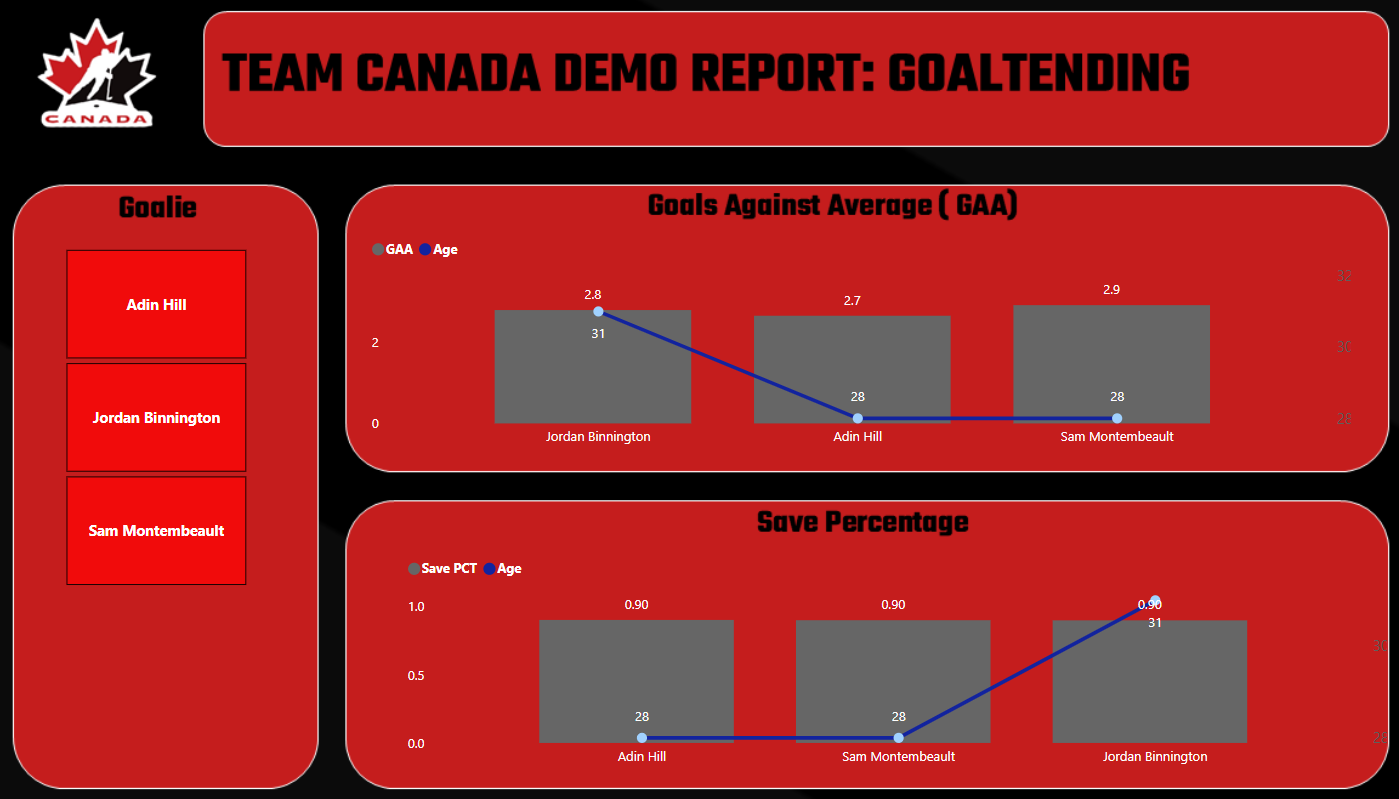
We still hold from our first newsletter that the statistics show that Canada is weaker in the crease. However, we also believe that they will produce more goals than they will let in and these goalies will rise to the occasion – given their experience.
Experience
And lastly, we wanted to see who was above the Average Points line (which was 34 at the time of our data pull), so we created a Scatter chart to plot Points by Age.
We've mentioned this before, but you don't want players clustered towards the bottom right (older players with lower point production); you want balance across experience and production. And Canada has this balance. Their Point Production to Age correlation is slightly negative (which is normal), and they have a healthy cohort of players above (or close to) the average, so this is net positive for them. We also like the fact that the cluster above the average line is towards the middle of the age group.
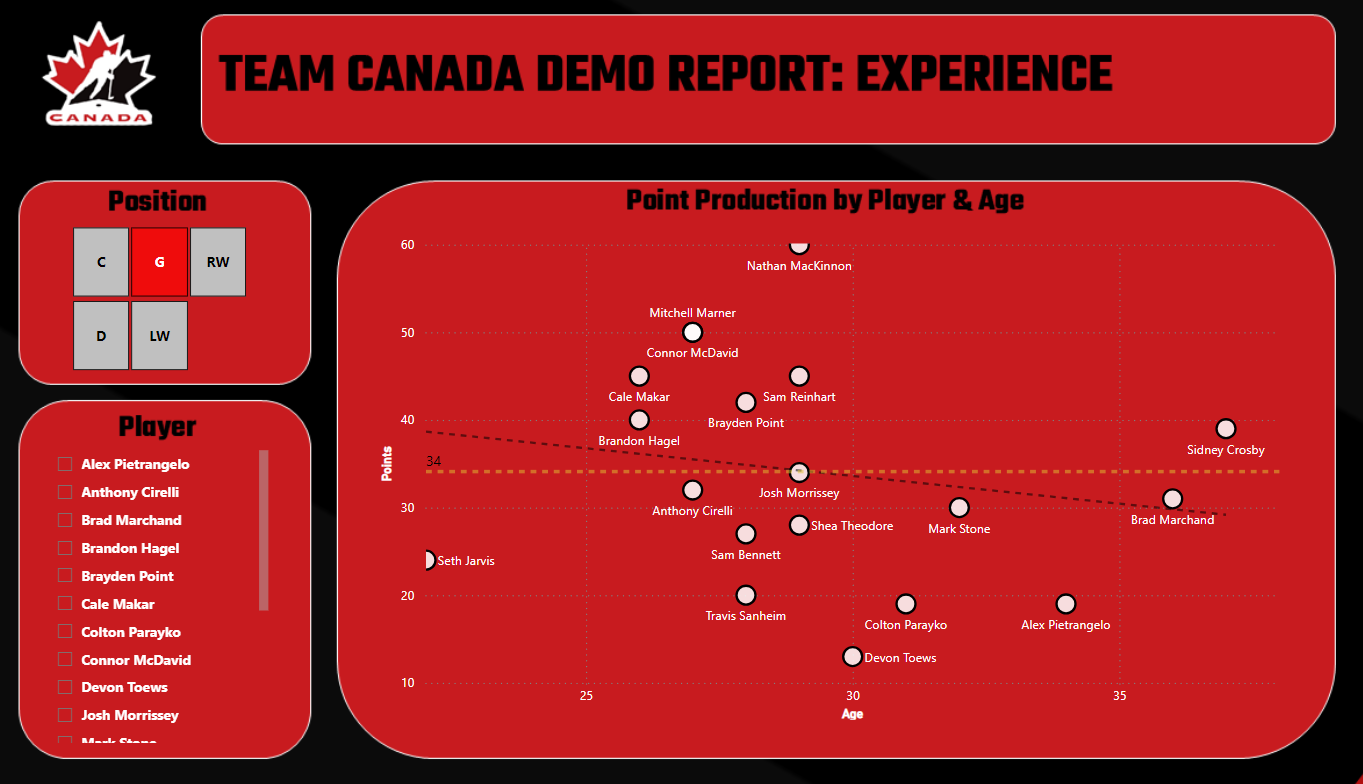
So, again, we see good things when it comes to Team Canada's forward line (which we believe will be highly productive), they have a strong defensive core, but their one weak spot could be goaltending (which the other teams in the tournament will be looking to exploit).
This Week's Prediction
So, does any of the above shift our first week's prediction? Yes, it does.
There will be a reprisal of the Team Canada vs. USA rivalry (think Vancouver, 2010). And while Team Canada crapped the bed in the World Juniors we don't see a repeat of this at the elite level.
Also, our prediction of Finland being the sleeper team is starting to develop some legs. Their gains this week are something we should watch.
So, our prediction this week is: 1) Canada, 2) USA, 3) Finland and 4) Sweden. We still see two rivalry matchups emerging within the tournament; that is, the Battle for North America and the Nordic Showdown.
Want more? Check out our quick-hit video on YouTube!
Summary
When we first started this series, we didn't think our analyses would shift our thinking week over week. But, it's happening. We're seeing interesting movement across the numbers – both good and bad this week, and we're seeing the two rivalries emerge that will bring drama to the tournament.
This week, we featured Team Canada in our deep dive. We flip-flopped on our last prediction, now moving Canada into the 1st position overall again. Goaltending still stands out as the top issue for which Canada may need to adjust. However, the forward core is strong as are their defensive line. So, if the superstar ensemble can hold the line up front, then the numbers say they will likely come out on top.
If you're interested in TSN's take on Canada versus the USA, then you'll definitely want to check out the below.
Next week, we'll focus on the final nation, USA. This will then put us in a good position to evaluate all of the teams side-by-side before we do a final prediction closer to the event.
Subscribe to our newsletter to get the latest and greatest content on all things hockey analytics!
Member discussion