4 Nations Face-Off: Is Finland the Sleeper Team?
At a Glance
- Overview of the 4 Nations Face-Off Series
A multi-part series covering the 4 Nations Face-Off tournament - What was our Prediction?
We revisit our very early prediction from last week - Overall Predictive Score
A single, calculated score that ranks the four teams - Deep Dive on Team Finland
Explores team recruitment, composition and offence, goaltending and experience - This Week's Prediction
Updates our prediction based on new findings and analyses from this week
Overview of the 4 Nations Face-Off Series
We kicked off our coverage of the 4 Nations Face-Off tournament last week with our newsletter entitled Early Predictions for the 4 Nations Face-Off Tournament. If you didn't read it and want a quick catch-up, check out the below video.
The goal of this series is to explore each of the national teams that are participating in the tournament, so we can predict who will win the tournament. To do this, we're analyzing a snapshot of player data from the 2024-2025 season through the following context:
- Where the teams are recruiting their players from;
- A deep dive on each nation's team to understand strengths and weaknesses; and
- A comparative analysis of the teams to create a predictive model to forecast who will win the tournament.
In this week's edition, we'll focus on Team Finland.
What was our Prediction?
We forced ourself to make an early prediction last week. As a recap, our prediction was built from offensive, physical (through penalties) and goaltending statistics – as represented below.
Our prediction was Canada in first, USA in second, Sweden in third and Finland in fourth. We also provided some justification, which you can explore in the newsletter. Definitely an early view.
For the next set of newsletters, we'll do a deep dive across each of the teams, each week revisiting our prediction based on what we explore and discover.
Overall Predictive Score
The summary statistics from last week were all fine and good, but they don't abstract the stats into a single rank score. So, our first place to start this week was through a composite score that represents an integrated view of offense, physicality and goaltending. We added some weightings to our calculations (offense and goaltending at 40% and physicality at 20%) and then created a score between 0 and 100. The results are below.
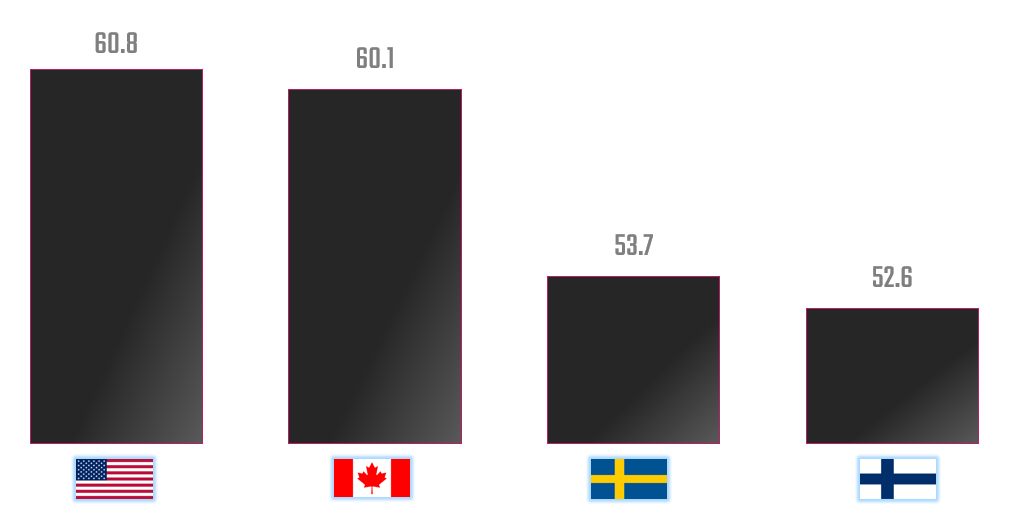
The initial summary statistics were more dispersed, but the above brings our initial stats into a single, calculated score that we can use to rank the teams. The above ranking is not far from where we were last week, but the score brings the USA out higher than Canada by a slim margin.
Calculated scores can be misleading; they can abstract the details away. Sometimes, these details are important and can mean the difference between a losing team and a sleeper team that revels in their underdog status. We're beginning to feel that there's a bit of this going on with Finland.
Deep Dive on Team Finland
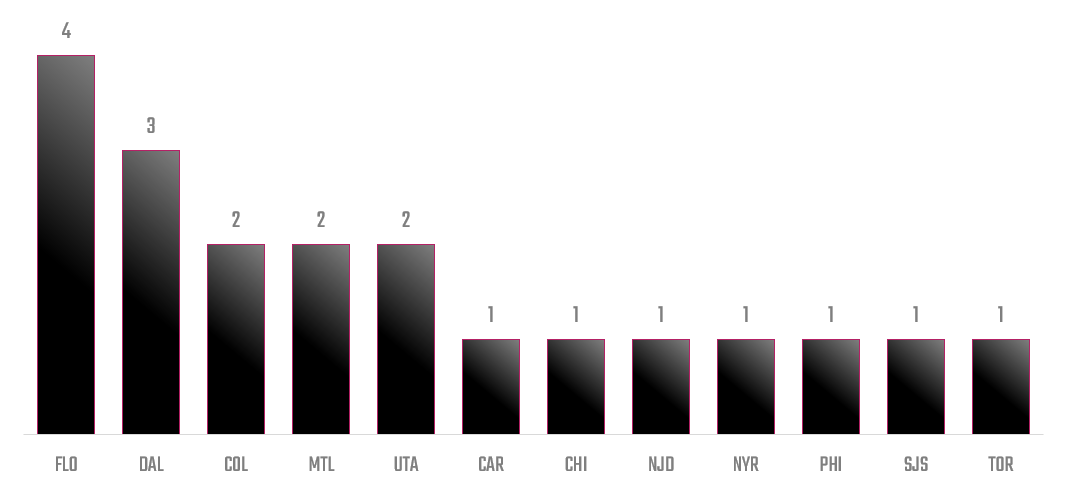
Each team has a slightly different sourcing strategy. Sweden and Finland are somewhat constrained by virtue of lower national representation in the league, but the USA and Canada are less constrained. That notwithstanding, it's interesting to look at where teams are recruiting two or more players. For example, Canada is relying more heavily on Colorado, Edmonton, Florida, Philadelphia, Pittsburgh, Toronto and Vegas. The USA are more heavily invested in Dallas, New York Rangers, Vancouver and Winnipeg. Sweden are more heavily reliant on Edmonton, Minnesota, New Jersey, and Nashville. And as you can see from the below, Finland has sourced 2 or more players from 5 teams. They've also sourced 4 players from Florida, a Stanley Cup team. This feels significant.
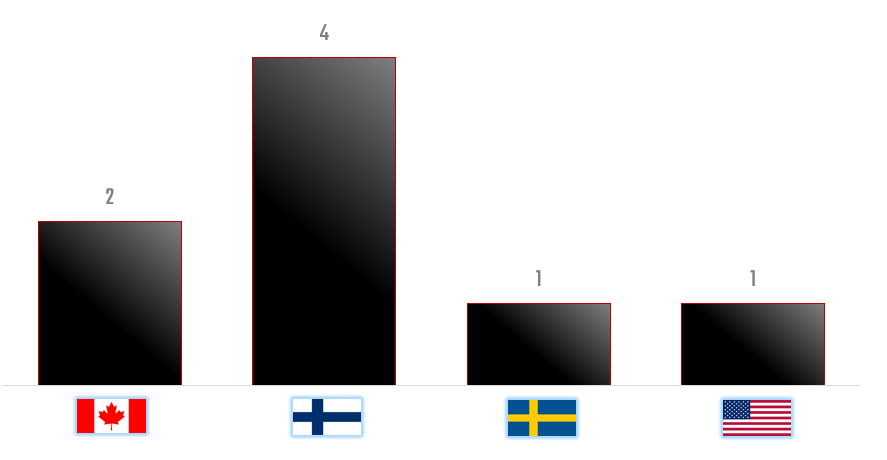
The number of players sourced from Florida gave us pause and we had to ask how this compares to the other national teams in the tournament? And, well, it's the biggest contingent across all of the national teams – twice as many as Canada.
And as we dove into the data, we began to see Finland in a slightly different light. In short, here's what we discovered:
- They have more players recruited into the team from a top team in the league.
- There's two classes of forwards: a cohort of power forwards that are at greater than 20 points and a second set of grinders (between 11 and 20 points).
- Across these two types of players, there is also a good amount of playmaking prowess on Team Finland – as measured through their Assists.
- They have a defensive formation that can move the puck up the ice – again high Assists for the defensive line.
- Team chemistry will be a factor with them having multiple players from a smaller number of teams.
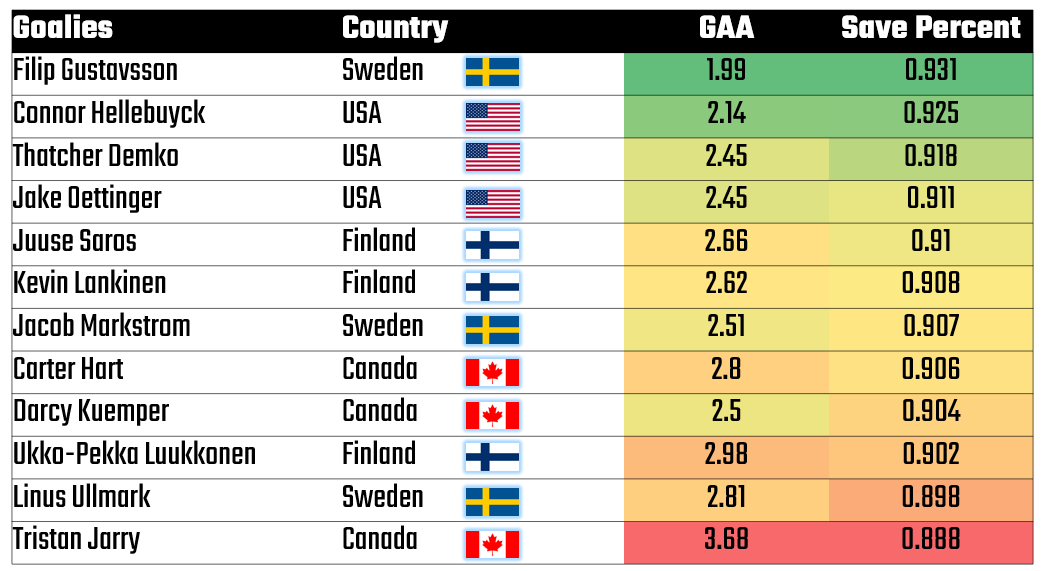
- Their goaltending may not be the best, but it's also not worst; it's sitting in the middle.
- And some might argue most importantly, they don't have the added pressure of expectations.
All of these factors combined have pushed us to reconsider our first prediction with Finland coming in 4th place to instead be in third as the "Official Sleeper Team." And like any sleeper team, they have the potential to disrupt the entire tournament.
So, where's the data on the above?
Team Finland Power BI Dashboard
To help with our deep dive on Team Finland, we built a Power BI dashboard. The dashboard comprises three reports:
- Offense – represented through Point Production
- Goaltending – showing GAA and Save Percentage
- Experience & Point Production – showing the relationship between Age and Points
Offense
In the first report, we have two Slicer controls and two Line and stacked column charts. The Slicer controls filter specific positions and players. The Line and stacked column charts visualize Points for specific players, along with Goals and Assists. The second chart shows Age versus Points.
From the Point Production (Goals & Assists) chart, you begin to see two classes of forwards emerge. Mikko Rantanen, Mikael Granlund, Sebastian Aho and Aleksander Barkov are stand-out players here. You can also see the playmaking reflected in the higher tallies of Assists more consistently across many of the players, indicating a secondary cohort of grinders. You can also see a decent age distribution with both young and older players having good, but varied, point production.
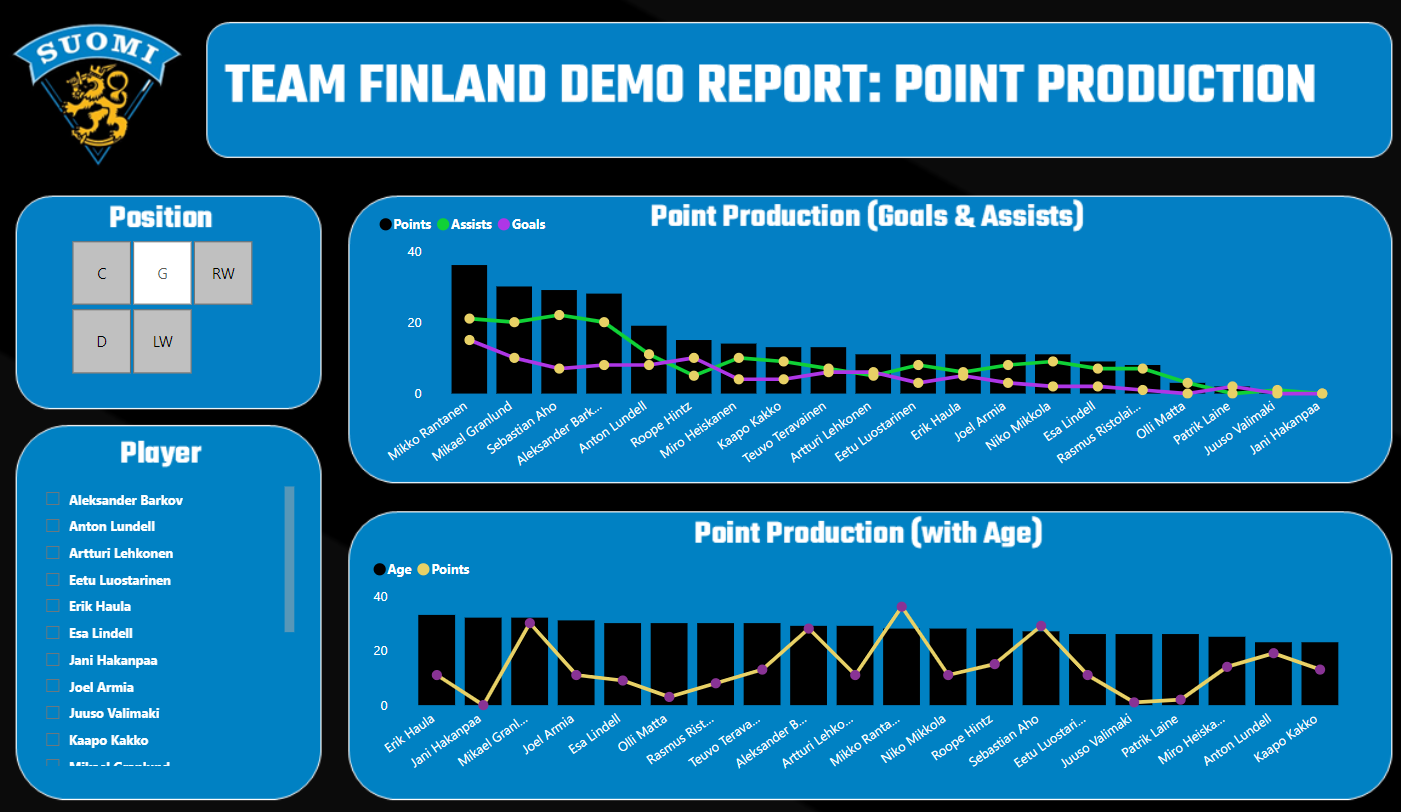
In short, when you push past the high-level summary statistics, you begin to see a different picture emerge about the forwards. A binary class of player with a good complement of goal-scoring and playmaking prowess with a decent distribution of talent across age groups.
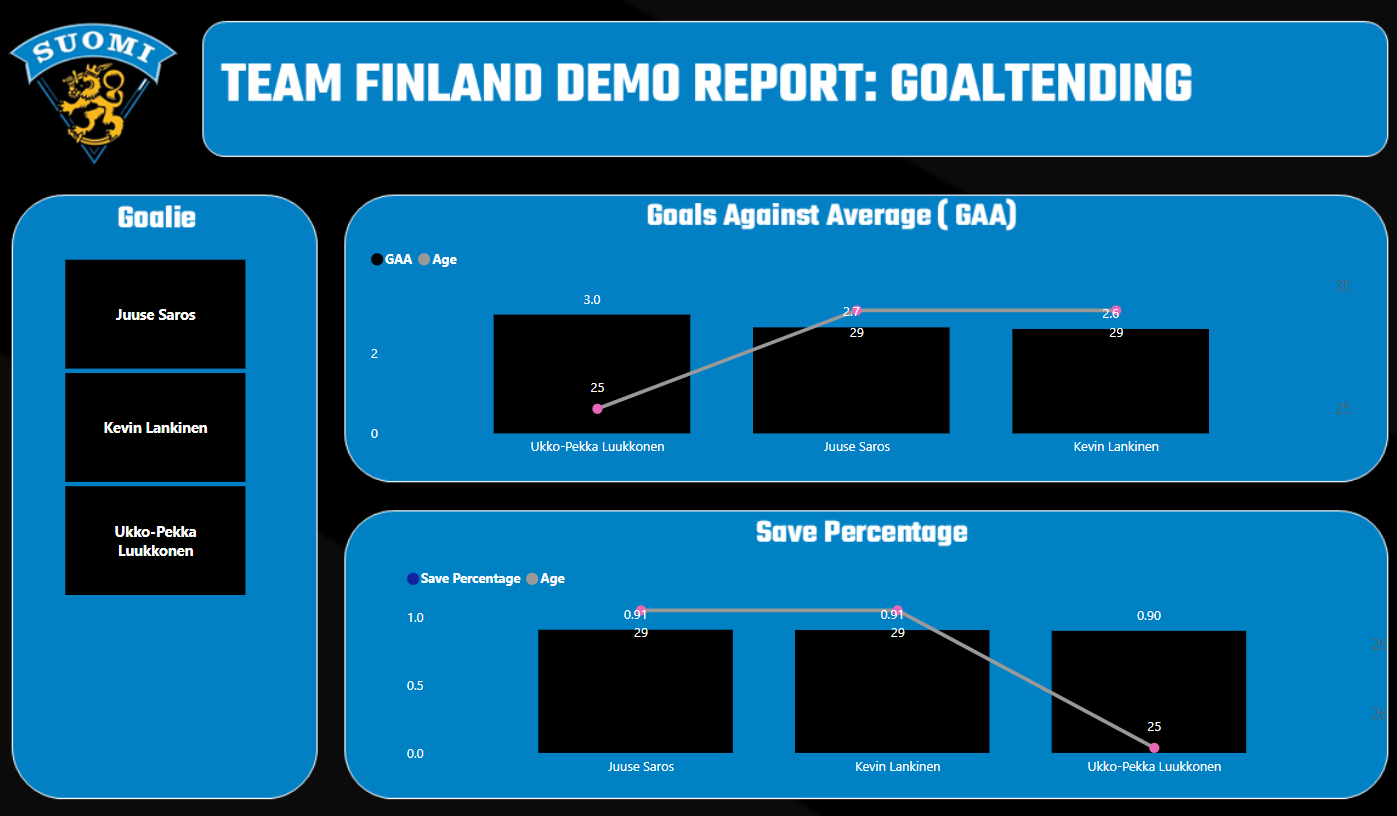
Goaltending
The second report includes a Slicer control and two Line and stacked column charts. The Slicer filters goalies, and the two charts measure Age versus GAA and Age versus Save Percentage. There's less to see here, but it's still important. Juuse Saros and Kevin Lankinen appear to be the stronger of the three goalies.
Experience
And lastly, we wanted to see who was above the Average Points line (which was 14 at the time of our data pull). Ideally, you don't have too many towards the bottom right (older players with lower point production); you want balance across experience and production. Here, we see an interesting spread of players across Age and above (or on) the average. This is a positive sign, which translates into a) a complement of young and experienced players who can produce, b) some younger plays who will have legs when the game calls for it (and can produce), and c) lower stress on the top-producing players. This view also reinforces balance between performers and grinders.
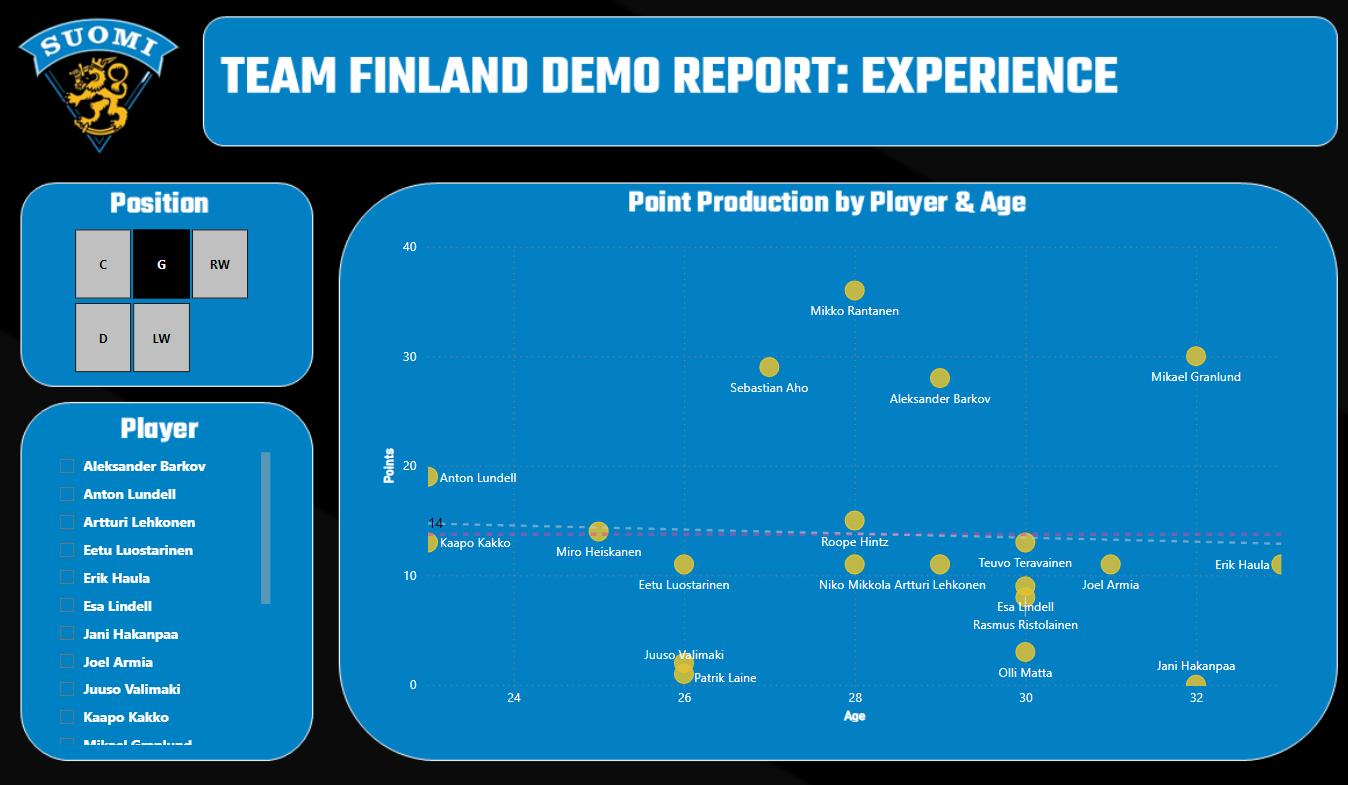
All told, some interesting and decent trends for Team Finland.
This Week's Prediction
So, does any of the above shift our first week's prediction. Short answer: yes.
We have two key takeaways from this week that shift our thinking:
- The first is USA moves to first place based on scoring slightly higher on the Overall Prediction Score. And Canada slips to second, but the margin between the USA and Canada is tight. We still hold the USA and Canada games are going to fun to watch with skill so close and national pride (and politics) on the line.
- The second is that we're now seeing a different dynamic in Team Finland's data. For all the reasons we've explored and listed here along with the relatively tight Overall Predictive Score with Sweden, we see them a) now in third place and b) as a sleeper team with low expectations and pressure on them in the tournament. We smell a bigger upset here.
Either way, this tournament is going to be fun to watch, and we see things heating up real quick.
Want more? Check out our quick-hit video on YouTube!
Summary
In this week's newsletter, we introduced a calculated metric called the Overall Predictive Score, which abstracts offense, goaltending and physical play into a single metric. Using this score, the new ranking is USA, Canada, Finland, and Sweden.
We also did a deep dive on Team Finland and discovered a dynamic beneath the surface that warrants us calling them out as the sleeper team in the tournament. We also built a dashboard that you can download and explore on your own (and extend to create your own version) that analyzed Team Finland's offense, goaltending and experience (age versus point production).
You can download the Power BI dashboard here.
Subscribe to our newsletter to get the latest and greatest content on all things hockey analytics!
Member discussion