4 Free Data Sources for Your Hockey Analytics Projects

At a Glance
- Finding Data is Difficult
- Sourcing Hockey Data
- Free Hockey Data Sources
Finding Data is Difficult
One of the more common complaints we hear from hobbyists and data analysts (especially those who are just getting started) is where to get good, reliable hockey data – not to mention at a low cost. It can be super frustrating finding a predictable, useful source of data that gives you the information you need at the time you want it.

In this newsletter, we'll walk you through different sources that we have used in the past. And by the end of this week's edition, you'll have four free sources of hockey data that you can use for your own analytics projects – be it for learning, Daily Fantasy Sports (DFS), sports betting or something else.
Sourcing Hockey Data
Depending on the nature of the project, we at DPH source hockey data from different providers. They are a combination of paid and free. For example, for the data we use every day, we've built a data pipeline that refreshes our datasets on a regular basis and uses My Sports Feeds as our paid data provider. For ad-hoc projects, we will download an instance (snapshot) of the data and then use it one time for that project. We use different data sources, depending on the nature of the ad-hoc project. And if we work with customers, we'll typically work within their proprietary data environment; this is a much more involved process involving security, governance and compliance.
For today, we'll keep it simple and assume that you are a hobbyist who is trying to access free data for your own projects. We'll show you four different reliable sources of hockey data and how to use them to download data for different scenarios into your local environment. For each free data source, we'll walk through a potential question – to guide what data you should target and the type of report you might want to create.
Check out our quick-hit video, if you want to skip reading the newsletter!
Free Hockey Data Sources
The four free data sources we'll walk through are as follows:
- NHL Stats
- Hockey Reference
- Natural Stat Trick
- Money Puck
Let's do this!
The NHL updates its data on a daily basis, so you can get updated stats, standings, and more. The NHL website also has the new NHL Edge, where you can query, filter and explore different statistics and explore the results through interactive visualizations.
There are two ways to get the NHL's statistical data. The first is to navigate to their stats page, query and filter for the data you want and then download it, which we'll cover today. The second is to use an unofficial NHL API to programmatically access the data; however, the API is not documented by the NHL and you need programming skills to use it.
If you navigate to the NHL stats page, you'll find different types of data, such as game data (e.g., scores, schedules, etc.), player stats (e.g., skater and goalie statistics), team data (e.g., team summary statistics, standings, etc.), and historical data (i.e., access to data from past seasons that includes player and team data).
Using the NHL Stats Data
Let's say you're working on your DFS lineup, and you have the following question: Who are the top twenty point-producing forwards?
To answer this question:
- Navigate to the NHL Stats page and click Skaters.
- Edit the filters for the most current season and include all skaters with all franchises.
- Click the P column header to sort from highest to lowest. You should now see something similar to the below.
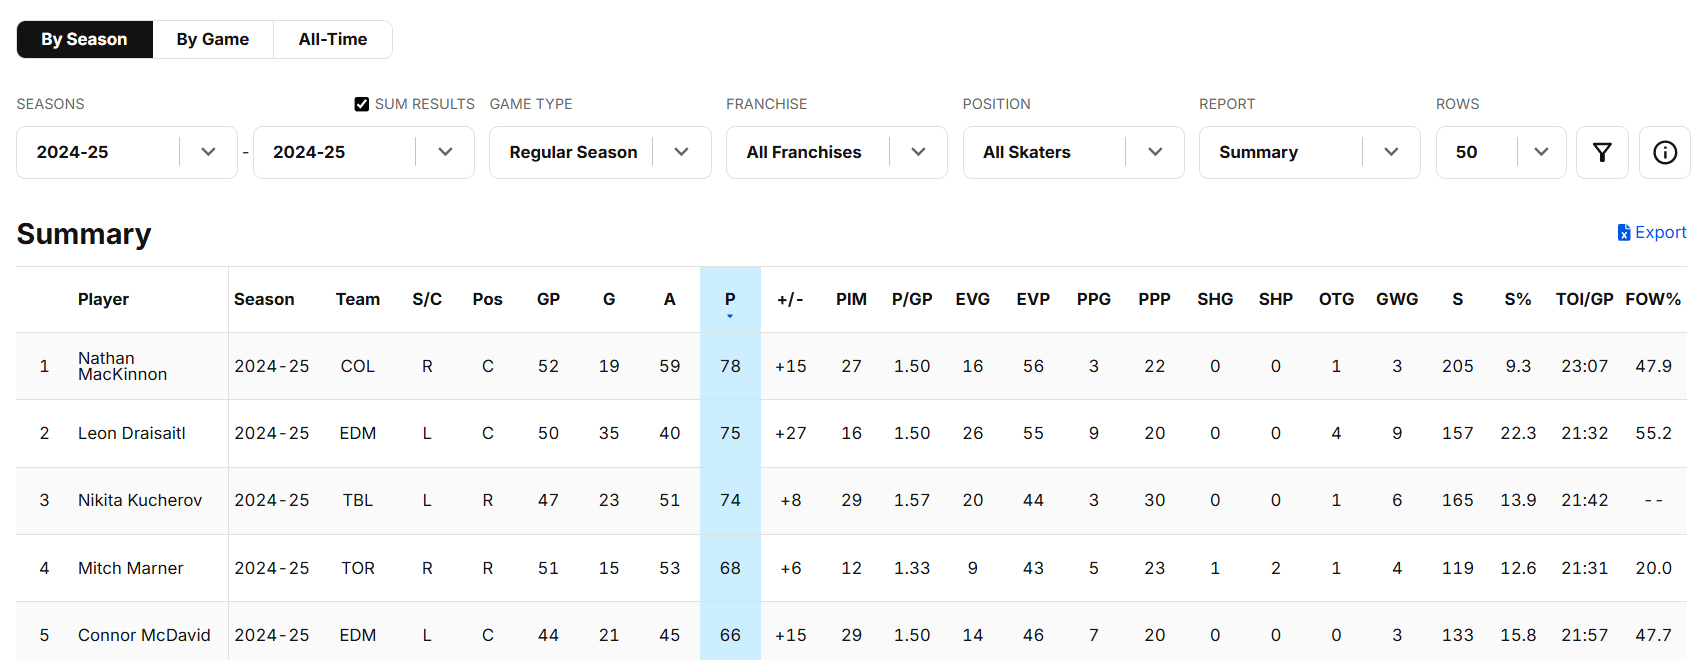
- Click Export.
- Open the downloaded Excel file, which will have the top 50 skaters by Points (P).
- Click the top-left cell and select Format as Table, accept the range and click OK.
- You can now hide the cells for the statistics you need, such as the below.
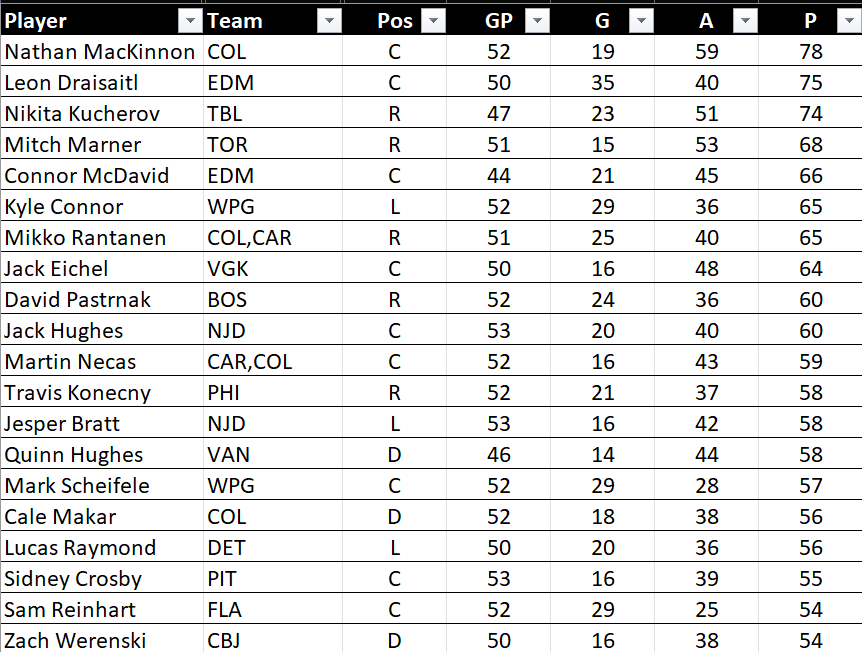
At this point, you can create new metrics (e.g., Goals per Game), tailor a report for your DFS picks, or use these core metrics as input into a Power BI or Tableau dashboard.
Hockey Reference is part of the Sports Reference family, offering an extensive archive of NHL data. There's a ton of historical data, and you can get details across teams, players and goalies across seasons. You can also access basic statistics and more advanced statistics.
Hockey Reference provides a solid mix of basic and advanced hockey statistics. For example, player and team statistics (e.g., goals, assists, and points), historical data (i.e., data for past seasons), season summaries (e.g., standings, league leaders, etc.), and head-to-head data (e.g., player and team comparisons).
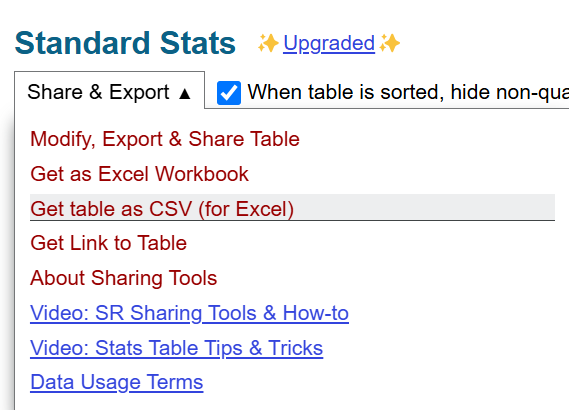
You can access the data from Hockey Reference by manually exporting the tables directly to CSV; you scroll to the bottom of a statistic page and click Get table as CSV.
Using the Hockey Reference Data
Let's say you want to answer the following question as a part of a sports project: Who are the top ten point-producing players across the last three seasons?
To answer this question:
- Navigate to the Hockey Reference website. Click Seasons and select the season you want, for example the 2023-2024 Season.
- Navigate down the page and select Get table as CSV (for Excel).
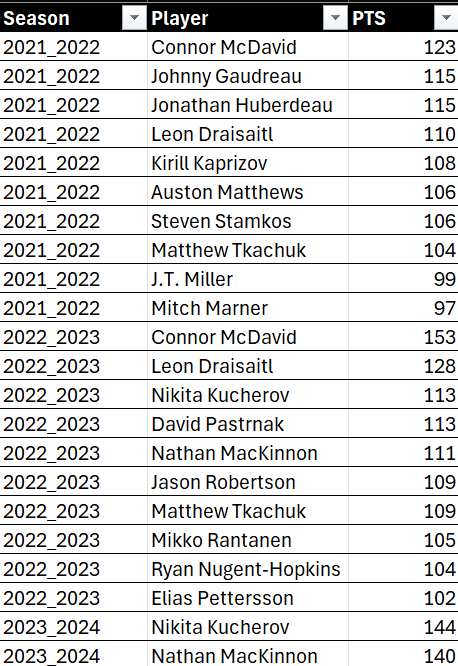
- Select the statistics on the web page and create a CSV file (e.g., copy and paste into Notepad and then save the file with the .CSV extension). Save the file locally to your computer.
- Repeat the above steps for all of the seasons you want, for example for the 2021-2022 season, 2022-2023 season and the 2023-2024 season.
- You can manually append one data file to the next, or you can use this simple Python script that you run from the same folder where you've downloaded the player stat files.
import os
import pandas as pd

folder_path = "."

player_stat_files = [file for file in os.listdir(folder_path) if file.endswith(".csv")]

data_frames = []

for file in player_stat_files:
    file_path = os.path.join(folder_path, file)
    in_mem_df = pd.read_csv(file_path)
    data_frames.append(in_mem_df)

merged_stats_df = pd.concat(data_frames, ignore_index=True)

output_file = "three_seasons_player_stats.csv"
merged_stats_df.to_csv(output_file, index=False)

print(f"The Player Stats files have been merged into {output_file}")
- You'll now have a dataset with three seasons worth of data for all NHL players.
- Again, you can manually analyze the file in Excel, or you can use the following R script to create a smaller data frame with the data you need to create your report.
library(tidyverse)

player_stats <- read.csv("three_seasons_player_stats.csv")

sub_player_stats_df <- player_stats %>%
  select(Season, Player, PTS)

top_10_players <- sub_player_stats_df %>%
  group_by(Season) %>%
  slice_max(order_by = PTS, n = 10) %>%
  arrange(Season, desc(PTS))

write.csv(top_10_players, "top_ten_players.csv", row.names = FALSE)
You now have an Excel file with three seasons worth of top ten point-producing players, with which you can create a trend report.
You can use Excel or R to create a graph that compares these players across the three seasons.
Natural Stat Trick is a good resource for advanced hockey analytics. It provides detailed breakdowns of team and player performance across different game situations, making it useful for those wanting to analyze trends and patterns beyond traditional stats.
Natural Stat Trick focuses on advanced statistics such as possession metrics (e.g., Corsi, Fenwick, etc.), game splits (e.g., 5v5, Power Play, etc.), player performance (e.g., High-Danger Scoring Chances, Shot Percentage, etc.), and goalie stats (e.g., Goals Saved Above Expected).
You access the data from Natural Stat Trick by navigating to the site and then filtering the data by season, team, or player and manually download it in CSV format for offline analysis.
Using the Natural Stat Trick Data
Let's say you want to answer the following question when trying to decide between two DFS picks: How does Connor McDavid compare to Nathan MacKinnon across key statistics?
To answer this question:
- Navigate to the Natural Stat Trick website and click Players, Compare.
- Select Connor McDavid in the first drop-down list and Nathan MacKinnon in the second.
- Select your filters and click Submit.

- After the results are returned, scroll to the bottom of the page and click CSV.
- Open the Excel file and transpose the data, so it's a bit cleaner. After a bit of editing, you'll be left with a table like the below with the two players and their metrics.

You can further customize the above report, or add additional players to get a broader comparative view that includes other players.
Money Puck is a data-focused website that specializes in predictive analytics and visualizations. The site's metrics, particularly Expected Goals (xG), have become a benchmark in hockey analytics.
Money Puck offers highly detailed statistics, including Expected Goals (shot-based data that quantifies scoring chances), player and team rankings (advanced metrics for evaluating performance and contributions), playoff probabilities (predictions for playoff qualification), and interactive visualizations (e.g., shot maps, win probability graphs, etc.)
Using the Money Puck Data
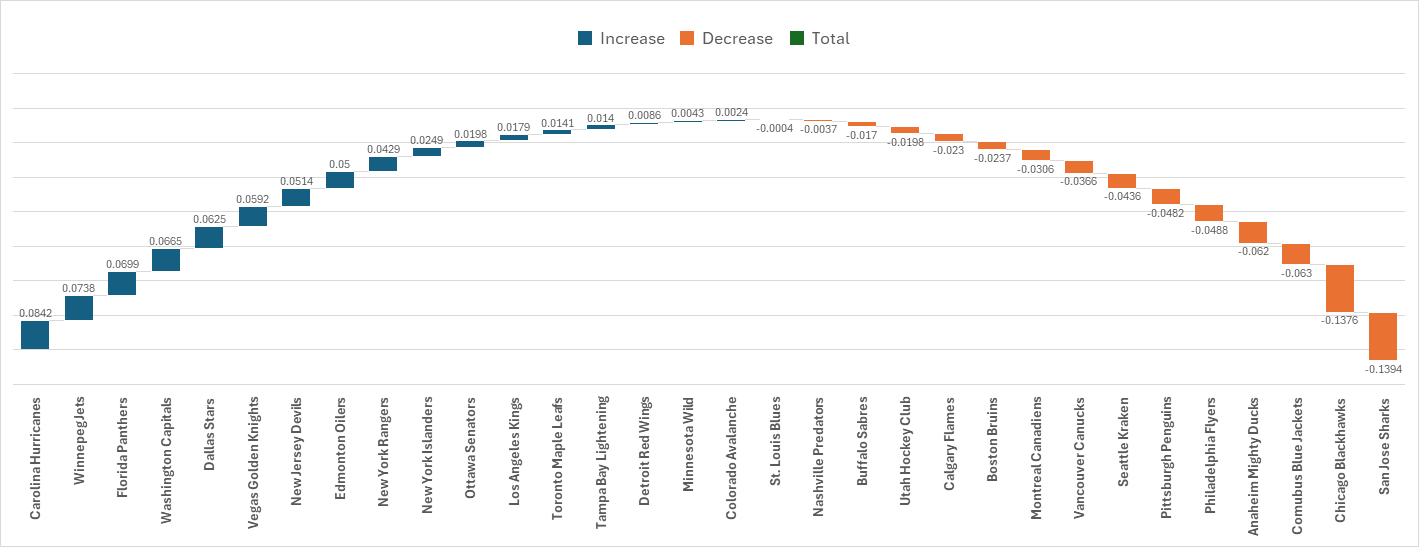
You can also access specific reports and data across the site. For example, let's say you want to answer the following question for a report you're trying to create: Who has the best current Power Ranking among the NHL teams?
To answer this question:
- Navigate to the Power Rankings page.
- Open Excel, and click Data, Get Data, From Other Sources, and From Web.
- Copy the Power Rankings page URL into the From Web dialogue box and click OK.
- Select NHL Power Rankings as the table to load into Excel.
- Create a PivotTable by clicking Insert, PivotTable. And select Team and Power Score.
- You can then create a chart, similar to the below, to chart the Power Rankings of the teams from highest to lowest.
How to Choose the Right Source
Each of these four resources has its strengths, depending on your needs. For example:
- The NHL stats should be considered the source of truth for the core NHL statistics; although, downloading the data is not optimal. For bulk downloads, and real-time/historical data, it's better to use the NHL API.
- Hockey Reference has a ton of data. And with some programming magic, you can source the data from Hockey Reference and then clean, structure and normalize it with Python and use R to implement your data science projects/models.
- Money Puck has some great visualizations, which are both informative and aesthetic (a lot of hockey sites don't really focus on data visualization and presentation). They also have data downloads with data definitions, which are also super helpful to understand what you're looking at with regard to data.
- For advanced stats and game analytics, check out Natural Stat Trick (or Money Puck). Natural Stat Trick doesn't have the richness of data feeds that some of the other providers do, but they've got some really useful data that as advanced statistical measures will complement reports built using other data sources.
Summary
In this newsletter, we walked through four free data sources, which were as follows:
We focused on the hobbyist this week, so were more about downloading the data for one-off, ad-hoc projects. In a future newsletter, we'll walk through how to leverage APIs and Web scraping to build a home-based sports data pipeline. This way, you have the flexibility to both download data for your individual projects and have a pipeline that is refreshed regularly for your more advanced needs.
Subscribe to our newsletter to get the latest and greatest content on all things hockey analytics!
Member discussion