Introduction to Hockey Analytics for Coaches & Parents
At a Glance
- Welcome to the Series
- Introduction to Hockey Analytics
- Basic Statistical Concepts
- Essential Hockey Stats
- How to Improve a Player's Shooting
Welcome to the Series
Welcome to Hockey Analytics for Coaches & Parents: Professional Analytics for Future Champs. In this series, we’ll break down the basics of hockey analytics (by picking a specific statistic each edition) and show you how to apply pro-level analytical techniques to develop a player's understanding of the game and performance.
This week's edition is an introduction to hockey analytics. We’ll cover basic statistics, key hockey metrics, and walk through an example of how you can use shot data to improve a player's shooting skills (using Shot Percentage).
Feeling lazy? Check out the quick-hit video below.
Introduction to Hockey Analytics
Let's start with a definition of hockey analytics:
Hockey analytics is the process of using data and statistics to evaluate and improve a player’s performance.
NHL teams and coaches rely on analytics to make informed decisions about team and player development, in-game strategies, and scouting. For example, teams use advanced metrics like Corsi and Expected Goals (xG) to assess puck possession and shot quality, helping them determine which players are making the biggest impact beyond traditional goals and assists. Analytics also play a key role in player evaluation, ensuring that coaching strategies are based on data rather than just gut instinct.
Why is it Important?
Hockey analytics helps measure player performance and provide input for player development. By tracking key stats—such as Shot Percentage, Points, and Puck Possession—you can identify areas of strength and opportunities for improvement. Whether it’s helping a player refine their shooting accuracy or encouraging them to take more high-quality shots, analytics gives you a structured approach to player development.
In this series, we'll explore hockey analytics through a professional lens and apply the findings to youth players. As youth hockey is becoming ever more data-driven, you'll see ways to leverage analytics and statistics to improve the play of those you coach or your son or daughter who you're trying to help become the next "Great One."
To do this effectively, it'll help to understand the differences among raw statistics (and statistical tools), hockey metrics, and contextual data; you can better understand how to apply them. While basic stats like Goals and Assists tell part of the story, deeper insights from analytics can reveal underlying trends in performance, offering a more complete picture of a player's impact on the ice.
Basic Statistical Concepts
Before getting too deep into the analytics, there are some basic statistical concepts that will help you interpret the data and metrics correctly. Statistical concepts enable you to interpret data. For example, when you apply statistics to box scores, you can determine which players are above or below average, who's in the 90th percentile, where some players are trending down and others up, and so on.
We've listed four key statistical concepts below.
Mean (Average)
Most of us know the term "average." It is a key statistical concept and one you'll come across time and again. In statistics, the mean is one of the measures of central tendency – which helps you understand the "middle" or "typical" value in a set of numbers.
In hockey, average is used a lot. It helps situate personal performance and then compares it to team performance. For example, if your daughter has played 5 games and scored a total of 7 goals, she scores an average of 1.4 goals per game. This is her personal average. If the team on average scores 3 goals per game, then your daughter is scoring roughly 47% of the team's goals.
Median
The median is the middle value in a list of numbers. This helps eliminate the effect of extreme values. If you have extreme outliers, the average will result in being further away from the true statistical center, so you can use the median instead. To calculate the median, sort the data in ascending order and take the value in the middle of the list. If you take the previous example with a team scoring the following number of goals in their last 7 games, 1+3+2+3+1+4+3, you find the median goals by sorting the list and taking the middle value. So, 1, 1, 2, 3, 3, 3, 4 is the sorted list and 3 is the median.
Mode
The mode is the value that appears most frequently in a data set. A set of data may have one mode, more than one mode, or no mode at all. If you take the previous example, you find the mode by sorting the values and finding the value that occurs the most. So, 1, 1, 2, 3, 3, 3, 4 is the sorted list and 3 is the mode.
Percentiles
Percentiles show how a player compares to others. Percentiles are useful when combined with other statistics, such as average scoring. For example, being in the 90th percentile in scoring means a player scores more goals than 90% of their peers. In other words, they're in the top 10%.
Essential Hockey Stats
Now that you've got your first four statistical concepts under your belt, let's explore some core hockey statistics. There are a lot of hockey metrics out there (especially at the pro level), but let's focus on a core set of stats that are commonly used in youth hockey.
Core Performance Statistics
Performance can be measured in many different ways, but for this week we're going to list a core set of statistics that represent "production," which are listed as follows:
- Goals (G): Measures the act of scoring a goal. It is a measure of finishing ability, but doesn’t always reflect total contribution.
- Assists (A): Measures the act of passing to a player who scores a goal (and can be a primary or secondary assist). Shows playmaking ability and involvement in scoring plays.
- Points (PTS = G + A): Summation of Goals and Assists and is a general indicator of offensive production.
- Plus/Minus (+/-): Tracks whether a player is on the ice for more goals scored vs. goals allowed. This has limitations as it depends on team strength.
- Shots on Goal (SOG): Tallies the number of times a player achieves a shot on goal. A good stat for understanding offensive activity.
Goaltending Statistics
These hockey metrics are the most common ones you'll find for goalies.
- Shots Against (SA): A measure of how many shots a goalie has faced.
- Goals Against (GA): Represents the number of goals scored against them.
- Goals Against Average (GAA): The average of their Goals Against across multiple games.
- Save Percentage (SV%): The percentage of time a goalie saves the puck.
Advanced Hockey Statistics
There are many advanced hockey statistics. We've listed a few that you might find useful for skaters.
- Shooting Percentage (S%): The ratio of goals scored to shots taken. A high S% with low shot volume means a player should shoot more. (Shooting Percentage is also referred to as Shot Percentage.)
- Expected Goals (xG): Evaluates the quality of shots, rather than just total shots.
- Faceoff Win Percentage (FO%): The percentage of time a centerman wins a faceoff.
If you were to collect and measure the above statistics for each game of a season for the skaters and goalies, you'd have a good starting point in understanding how well your team is performing from an offensive production and goaltending perspective. For example, let's say you have the statistics for a player (a forward) across 20 games. Using the above statistics, you can create a report for them that includes:
- Totals of all of the statistics – e.g., G, A, PTS, etc.
- Averages of specific metrics to evaluate performance per game – e.g. AVG GPG, AVG PTSPG, etc.
- A trend report that shows his consistency over each of his games.
If you're a coach, you can also do the same for your team. These reports are called a Player Performance Report or Team Performance Report.
How to Improve a Player's Shooting
As kids, we spent endless hours on the driveway shooting at a net with a hockey ball. It was fun, and the repetition was good. But, it would've been more useful if we'd practiced specific shot types from different distances from the net with an understanding of which ones were more likely to result in a goal. Most of the time, we just wanted to slap the puck as hard as possible against the garage or the plexiglass.
On a serious note, every analysis should start with a question, and since we're talking about shots let's pose the following two questions:
- What are the shots that are more likely to result in a goal?
- How can I use this to improve a player's scoring chances?
Let's assume the player in this case is your son who you coach and tackle each of these questions in turn.
Where are the shots that are more likely to result in a goal?
When analyzing data, determine your benchmark. We're going to use the NHL as our benchmark for shooting statistics.
For example, we sourced a sample of NHL game data and then classified the types of shots and if they resulted in goals, which you can see below. The visualization is dynamic, so you can sort each of the columns. Each row is calculated independently, so the Goals Percent (GOALS_PCT) is the percentage of time that shot type results in a goal.
What's interesting here is that the Tip-In is the highest (save for the open net or Other), but this is rarely the go-to shot for kids. It's more who can take the hardest slap shot (which has the lowest success rate).
Now, you've probably figured this out, but it's not just about the type of shot, but it's also about the distance to the net. Tip-ins are typically executed close to the net whereas slap shots are from the top of the circle and beyond. And generally, the further away from the net you travel, the less accurate your shot and less likely you are to score. Below are the average distances across all of the shot types from the net.
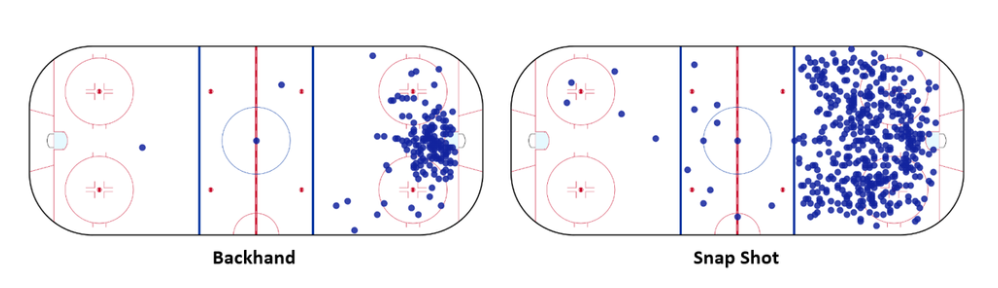
Here's another view from our game data, but this time through a custom scatter plot comparing two shot types. The Backhand is executed close to the net, and the Snap Shot from all over the offensive zone. (Each dot represents the X, Y coordinates of a shot.)
So, knowing the types of shots that are more likely to result in a goal and the typical distance of where those shots are executed, how can you use this information to help your son?
How can I use this to improve a player's scoring chances?
The first step in any analysis is to collect the data. There are a number of apps out there that parents and coaches can use, or you can assign someone to collect the statistics manually each game. To analyze shots, you'll want to collect Shots on Goal, Goals, Assists, and Points at a minimum.
The second step is to calculate the following hockey statistics:
- Shots on Goal
- Goals
- Shot Percentage
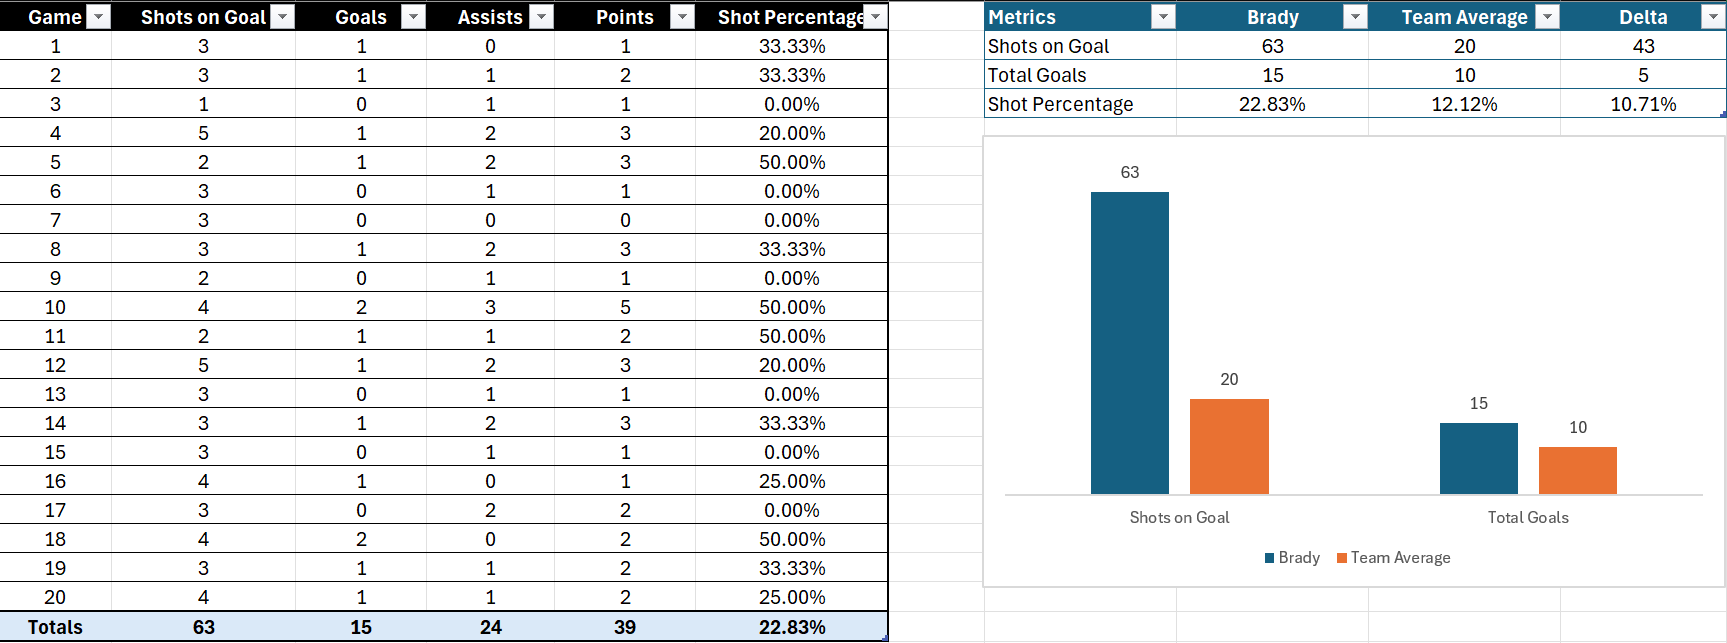
Calculate this for each game and then calculate for the entire season. For example, below is a view for 1 player for 20 games.
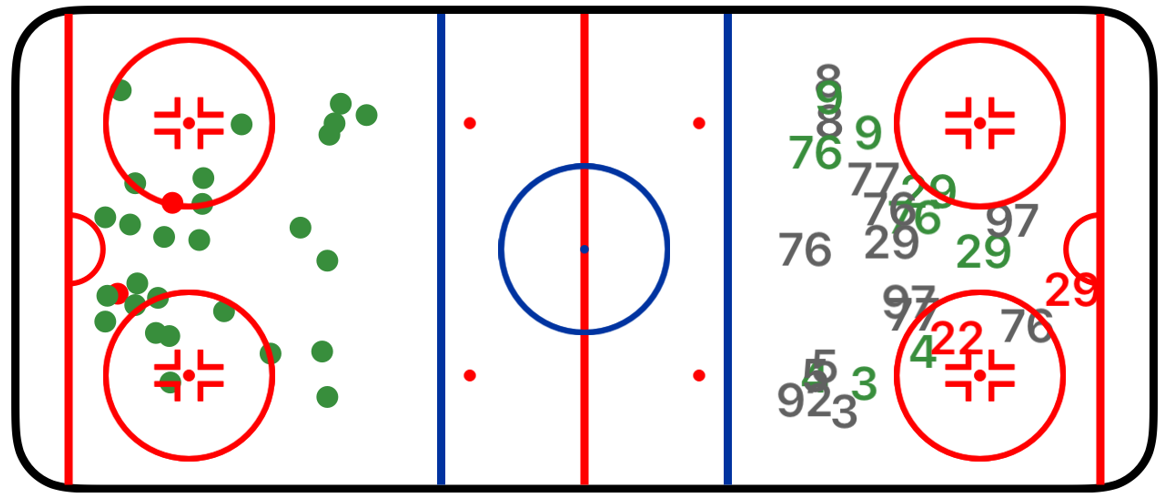
If there is a shot scatter plot available from the youth hockey league, the third step is to evaluate where the shots are coming from, and which ones are resulting in a goal. For example, here is a sample scatter plot of shots for a youth game. The green dots are shots, and the red dots are shots that resulted in a goal – and they are close to the net.
The fourth step is to analyze the data and identify areas for improvement.
- If your son has a high Shots on Goal but low Shot Percentage, then they're not converting to goals. One remedy would be to work on shot type, shooting distance from net and accuracy.
- If your son has low Shots on Goal but a high Shot Percentage, they may have good shooting skills, but they're not shooting enough. One remedy would be to encourage them to shoot more.
- If your son has a high Shots on Goal, low Shot Percentage and is shooting from the top of the circle, then they may need to get closer to the net. One remedy would be to teach them ways of shooting closer to the net (or looking to pass for the tip-in).
And finally, the last step is to set goals and adjust training. This is where you help your son with more specific goals based on what you discover from the analysis. For example, let's assume that your summary from your son's analysis is as follows:
- My son is a centerman who is 8 years old and plays for a competitive travel team.
- He gets an average of 5 Shots on Goal per game and scores .5 Goals per game.
- His default shot is a slap shot. He typically winds up just over the blue line (and before the top of the circle), but he's not converting his shot attempts to goals.
With this in hand, a set of recommendations might be:
- Do more wrist strengthening exercises off ice – e.g., curls and wrist curls, push-ups, etc.
- Practice the strength, speed and accuracy of your wrist shot – on and off the ice.
- Find ways to get closer to the net before you shoot – e.g., top of the hashmarks to in the slot.
- Double the amount of wrist shots you take while reducing the amount of slap shots by half.
- Bonus: When closing in on the net, look for give-n-go opportunities with your team mates (to increase your Assists).
This is a specific, measurable training program that you can define and tweak with your son.
Summary
This was the first in a series of newsletters that will focus on helping hockey coaches and parents with analytics. The goal of this series is to introduce you to basic statistics and hockey metrics and then show you different ways to help analyze and improve a player's game. Each edition, we'll explore one statistic through a professional lens and apply it to youth hockey.
Hopefully, you see how you can leverage professional hockey analyses and reports to understand what works at the professional level. This arms you with a qualitative benchmark to analyze the game at the youth level. And with that benchmark, you can collect player data, assess that data and then formulate specific, measurable plans to improve their performance – in this case their shooting skills.
Hockey analytics is pervasively used at the professional level, and there is an increasing amount of data available at the youth level. There's no reason why you can't help improve a player's game by combining a little bit of math coupled with some hockey knowledge and analytics.
Subscribe to our newsletter to get the latest and greatest content on all things Data, AI and Hockey!
Member discussion