More Winning Strategies and Statistics for DFS fantasy Hockey!

In this Edition
- DFS Fantasy Hockey Series Recap
- Expanding the Winning DFS Strategy
- More Examples of Winning DFS Strategies
- Mapping Statistics to DFS Strategies
DFS Fantasy Hockey Series Recap
This is Week three in our six-week newsletter series on Winning in DFS Fantasy Hockey using Analytics. In the first two editions, we covered the following topic:
- Week 1: DFS Fantasy Hockey 101: Your Ultimate Kickoff Guide!
- Week 2: Winning DFS Strategies & Stats to Crush Fantasy Hockey
In this week's edition, we'll continue to explore different winning strategies for DFS and how these strategies map to specific statistics. After today, you'll have multiple DFS strategies to consider along with a rough mapping to scoring and analytics. Next week, we will then transition into translating DFS analytics into useful tools and dashboards to bring a winning, data-driven DFS system to life.
Expanding the Winning DFS Strategy
In our last newsletter in this series (Winning DFS Strategies & Stats to Crush Fantasy Hockey), we introduced a simple DFS fantasy hockey system that aligned Scoring, Strategies and Statistics. The notion was to understand DraftKings' scoring, design a set of winning strategies and then align statistics that allow you to measure your strategies – all of which can help your decision making.
We walked through the elements of the system by:
- Exploring the DraftKings scoring system
- Defining a sample of winning DFS strategies
- Defining statistics (and analyses) that support the DFS strategies
However, we didn't discuss how the system could be implemented or what to consider when implementing the system; we only talked through the elements of the DFS system.
When we expand the system, we provide more context around the original frame on how the elements come together and what you should be contemplating come decision time. For example, let's take one strategy (High Shot Volume Players) from last week and run some water through our three-tiered DFS system as a test.
Explaining High Shot Volume Players
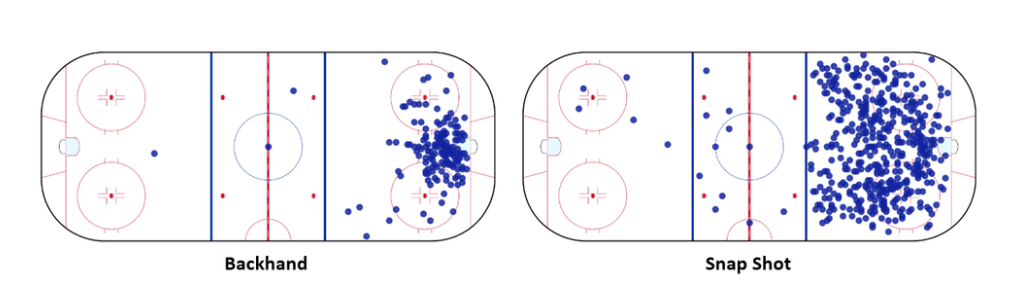
The first step is to understand why shots are generally important in hockey and why they're important in DFS fantasy hockey. It's pretty straightforward: shots on goal lead to goals, which lead to wins. Now, not all shots are created and delivered equally! For example, in our newsletter entitled Analyzing Shots and Their Relationship to Goals, you can see that shots are often clustered within the offensive zone. Further, different types of shots occur at varying distances from the net; for example, the backhand is tight to the net and the snap shot can be taken from anywhere in the zone. These differences are illustrated below, with the blue dots (representing shots on net) for a backhander tightly clustered around the net and snap shots having a wider, broader cluster – though still as tight because the snapper is more commonly used.
Generally speaking, the more shots on goal a player has (especially high-quality shots on goal), the more likely they are to score a goal. And fortunately, we can measure this. So, let's lay out the logic for the DFS system using one of the Player scores on DraftKings: Shots on Goal.
- Scoring: For each shot on goal for the players you choose within your lineup, you'll receive 1.5 points.
- Strategy: You leverage your High Shot Volume Players strategy, which means selecting players who consistently generate a high number of shots on goal. (Note the word consistently because this is important when it comes to your analyses.)
- Statistics: You should collect the following statistics (at the player level):
- Total Shots on Goal
- Shots on Goal per Game
- Shooting Percentage
- Total Shot Attempts
- Shot Attempts per Game
Using the total stats, you can rank the top players across the three seasons – this is the high-level view. You can use this data to find the cluster of top-ranked players within. You can also find the players who are on the same team. And you can do this across seasons.
Using the average stats, you can see the player's performance within a single game (or across a set of games). You could use your top-ranked cluster and then get more detailed, game-level information about these players, or you could start with all players and then see if the cluster here is similar to the top-ranked cluster.
In sum, with three seasons worth of the above statistics, you can create two reports that will help make decisions on players for your DFS lineup:
- The first would contain: 1) a top rank view of the players with Total Shot Attempts, Shooting Percentage, and Total Shots on Goal and 2) a trend view of these same statistics across three seasons.
- The second would contain: 1) a ranked view for average Shot Attempts per Game and Shots on Goal per Game, and 3) a trend view across three seasons and within a single season for average Shot Attempts per Game and Shots on Goal per Game.
Each of these reports provides an all-up ranking of players in the shooting category and also gives you insight into how they perform over time – so if they perform consistently. This is, of course, reports for just one strategy.
More Examples of Wining DFS Strategies
You'll settle on a set of winning DFS strategies that work best for you. Last week, we covered three winning DFS strategies (Line Stacking, High Shot Volume Players, and Player Injuries), so this week we'll cover another four:
- Optimal Lineups
- Winning Goalies
- Balance Star Players
- Vegas Odds
Optimal Lineups
This strategy involves constructing a lineup that maximizes point potential while staying within the salary cap. The goal is to achieve the highest score by selecting players who might outperform their salary value, with an emphasis on correlation, value, and upside.
DraftKings' scoring system rewards points for a variety of player actions, including goals, assists, shots on goal, blocked shots, and goalie statistics (wins, saves, shutouts). The Optimal Lineup strategy leverages this scoring system by, for example, focusing on high-scoring players, prioritizing shots and blocked shots and balancing salary with expected output.
Drew Dinkmeyer, Founder of DailyRoto and a highly successful DFS player, emphasizes the importance of constructing optimal lineups by using data-driven tools and projections. He highlights the need to account for player roles, matchup context, and expected usage when building lineups. Dinkmeyer has won numerous DFS championships, including the DraftKings Millionaire Maker.
Winning Goalies
This strategy involves selecting goalies who have the highest probability of winning their game, while also having a strong likelihood of accumulating points through saves and, ideally, earning a shutout. Since goalies have a significant impact on your DFS lineup’s total score, choosing the right goalie is important.
In DraftKings, goalies can earn points through wins, saves and shutouts. Conversely, they are deducted points by having goals scored against them. Given this scoring structure, a goalie can contribute significantly to your lineup’s success by securing a win, racking up saves, and preventing goals.
Adam Levitan, co-founder of Establish The Run, frequently discusses the importance of choosing the right goalie in DFS, especially in cash games where the emphasis is on minimizing risk. He suggests focusing on goalies with strong home records, solid team defenses, and favorable matchups against low-scoring opponents. Levitan has seen consistent success in cash games and smaller GPPs by focusing on secure goalie picks, often finishing in the top ranks of these contests.
Balance Star Players with Value Picks
This strategy involves constructing a lineup that includes a mix of high-priced star players and lower-priced value picks. The stars provide a stable point base, while the value picks allow you to afford those stars and potentially outscore their cost.
DraftKings’ salary cap format necessitates finding underpriced players who can outperform their salary. Balancing your lineup ensures you’re not overly reliant on any one player and can exploit mispriced players.
Drew Dinkmeyer has consistently used this approach. He emphasizes the importance of finding value in players who are underpriced relative to their potential role or matchup. Dinkmeyer has won several high-stakes DFS tournaments using this balanced approach, particularly in NHL and NFL DFS, leading to his reputation as one of the top DFS players.
Vegas Odds
This strategy involves using the betting odds provided by sportsbooks (often referred to as "Vegas odds") to guide your player selection process. These odds include Moneyline odds, over/under totals, and puck line odds, which can give insights into how a game might play out in terms of scoring, game pace, and potential winners. By leveraging these odds, DFS players can make more informed decisions about which teams and players to target.
Vegas odds are valuable because they offer a predictive analysis of game outcomes, which aligns well with the DFS scoring structure on DraftKings. For example:
- Moneyline Odds indicate the likelihood of a team winning the game. A team with strong Moneyline odds (+100 or lower) is more likely to win, which is particularly important for selecting a goalie, as wins are crucial for goalie points (+6 points per win).
- The over/under line predicts the total number of goals expected in the game. A higher over/under (e.g., 6.5 goals or more) suggests a high-scoring game, making skaters from these games more attractive for DFS as more goals, assists, and power-play points can be expected.
- Puck Line Odds is similar to a point spread in other sports and gives a sense of how close or lopsided the game might be. A team heavily favored on the puck line is expected to dominate, which could indicate strong offensive and defensive performances, beneficial for both skaters and goalies.
David Kitchen (Socrdave) is a well-known DFS expert, who has implemented the Vegas odds strategy to optimize his lineups, particularly in high-stakes GPPs. He uses the odds to identify favorable matchups and games likely to exceed scoring expectations. Kitchen has also seen significant success in DFS contests, particularly in GPPs where his use of Vegas odds to identify under-the-radar game stacks has paid off. His strategy of targeting games with high over/under totals has led to several big wins.
Mapping Statistics to DFS Strategies
For each of the four aforementioned DFS strategies, you can map statistics to those strategies to create an analytically-driven system. This could be as simple as listing out some key statistics, creating an Excel spreadsheet, updating that spreadsheet on a daily basis, and then checking the stats against your strategies.
Optimal Lineups
A set of statistics and data that would help implement this strategy would be:
- Player Points Per Game (PPG): Track the average fantasy points each player scores per game.
- Player Salary: Record each player’s salary to analyze value and efficiency.
- Projected Points vs. Actual Points: Measure how often players meet or exceed their projected points.
- Player Usage Metrics: Time on Ice (TOI), power play time, and shifts per game.
- Player Matchup Stats: Performance metrics against specific teams or in certain game situations (e.g., home vs. away).
Examples of analytics you'd want to build are as follows:
- Value Report: Generate reports that compare PPG to player salary to identify undervalued players.
- Optimal Lineup Simulation: Run simulations to create optimal lineups based on projections, salaries, and matchup data.
- Performance vs. Projections Analysis: Analyze discrepancies between projected points and actual performance to refine projection models.
- Stacking Effectiveness: Analyze the effectiveness of stacking specific lines or power play units in previous contests.
Winning Goalies
A set of statistics and data that would help implement this strategy would be:
- Win Probability: Use the Vegas Moneyline odds to estimate the probability of a win for each goalie’s team.
- Saves per Game: Track average saves per game for each goalie.
- Goals Against Average (GAA): Measure the average number of goals a goalie allows per game.
- Opponent Shot Volume: Track how many shots on goal the opposing team averages per game.
- Team Defense Metrics: Shots allowed per game, penalty kill percentage, and blocked shots by the team.
Examples of analytics you'd want to build are as follows:
- Win Probability Report: Analyze goalies with the highest win probabilities based on Vegas odds.
- Goalie Efficiency Analysis: Compare saves per game against goals allowed to identify high-efficiency goalies.
- Opponent Scoring Threat Analysis: Analyze how likely an opposing team is to score based on recent performance.
- Goalie Matchup Report: Generate reports comparing goalies' performances against specific teams or types of opponents.
Balance Star Players
A set of statistics and data that would help implement this strategy would be:
- Star Player PPG: Track the points per game of high-salary star players.
- Value Player Metrics: Track PPG and salary for lower-priced players to identify potential value picks.
- Player Consistency: Measure the standard deviation of a player’s game-to-game performance to assess reliability.
- Injury Reports and Line Changes: Monitor news that might affect player roles or opportunities, such as injuries or promotions to higher lines.
- Power Play and Penalty Kill Metrics: Track how much time star and value players spend on special teams and their effectiveness.
Examples of analytics you'd want to build are as follows:
- Star vs. Value Analysis: Create a report that compares the combined points of star players and value players to identify optimal combinations.
- Consistency Reports: Analyze which players have the most consistent performances, making them safer plays.
- Injury Impact Analysis: Assess how injuries or lineup changes affect the roles and potential output of star players and value picks.
- Salary Efficiency Analysis: Compare PPG to salary for each player to determine who provides the best value relative to their cost.
Vegas Odds
A set of statistics and data that would help implement this strategy would be:
- Moneyline Odds: Collect the odds for each game to assess the likelihood of a team winning.
- Over/Under Totals: Track the expected total goals for each game.
- Puck Line Odds: Measure the expected margin of victory to gauge the potential dominance of a team.
- Team Scoring Averages: Record the average goals scored by teams, especially in high-over/under games.
- Line Movement: Track how odds change leading up to the game, which can indicate where the betting money is going.
Examples of analytics you'd want to build are as follows:
- Win Probability Analysis: Use Moneyline odds to generate reports highlighting teams (and their goalies) most likely to win.
- Game Pace Report: Analyze games with high over/under totals to identify matchups that are likely to be high-scoring.
- Vegas Line Movement Analysis: Track changes in betting lines to identify games where public sentiment is shifting, which might indicate insider knowledge or late-breaking news.
- High-Scoring Game Targeting: Identify games with the highest expected goals (based on over/under totals) to target for DFS stacking opportunities.
Check out our YouTube quick-hit video below.
Hopefully, this gives you a sense for how you can begin mapping scores to strategies to statistics. In our next newsletter, we'll take this mapping one step further and begin the process of building an analysis for one of the strategies.
Summary
In this week's newsletter, we continued to explore different winning strategies and again aligned sample statistics to those new strategies. In our next newsletter, we'll take one of the strategies and build it out end-to-end. That is, we'll look at specific scores, take one of the strategies we've discussed in this and last week's newsletter and then mock up a report.
In doing this, we'll explore 1) how the three elements of the winning DFS system come together, 2) the data that is required to feed the report, and 3) design the report that will implement the winning DFS system.
Subscribe to our newsletter to get the latest and greatest content on all things hockey analytics!
Member discussion