Building Your First Data Pipeline for Hockey Analytics Projects

At a Glance
- What is a Data Pipeline?
- Building a Basic Data Pipeline
- Key Steps to Build a Homemade Data Pipeline
- Walkthrough: Building Your First Data Pipeline
What is a Data Pipeline?
A data pipeline is a series of processes that move data from one system to another while transforming, cleaning, and storing it along the way. It ensures that raw data is collected, processed, and made available in a structured format for analysis, reporting, or machine learning applications.
For example, let's say you want to build a homemade data pipeline. The goal of the pipeline is to source data from multiple providers that you can use to create a custom report to support your sports betting – e.g., collect and aggregate team and player performance metrics along with predictive forecasts to help you make the best decisions possible. The below is a diagram that represents what your pipeline might look like.
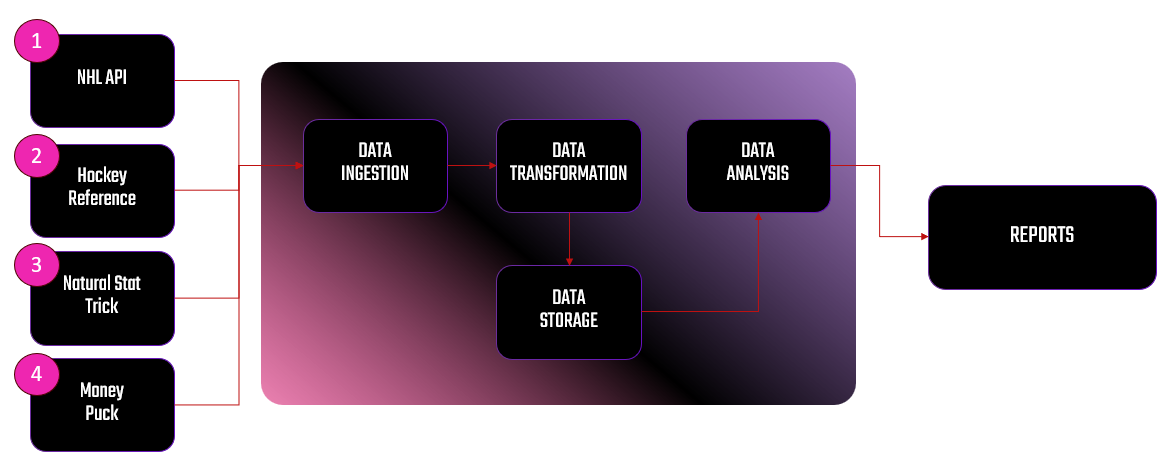
The processes within the data pipeline are data ingestion (is the point of ingestion into the data pipeline), data storage (where raw data files are stored), data transformation (where data is cleaned and transformed), and data analysis (where the data is analyzed and/or predictive models are built). The final stage, REPORTS, is where users can see the results of the data analysis.
Building and maintaining data pipelines typically falls under the purview of the data engineer. However, if you're someone who is pursuing data analytics, data science or sports science, you should have at least a basic understanding of data pipelines.
Building a Basic Data Pipeline
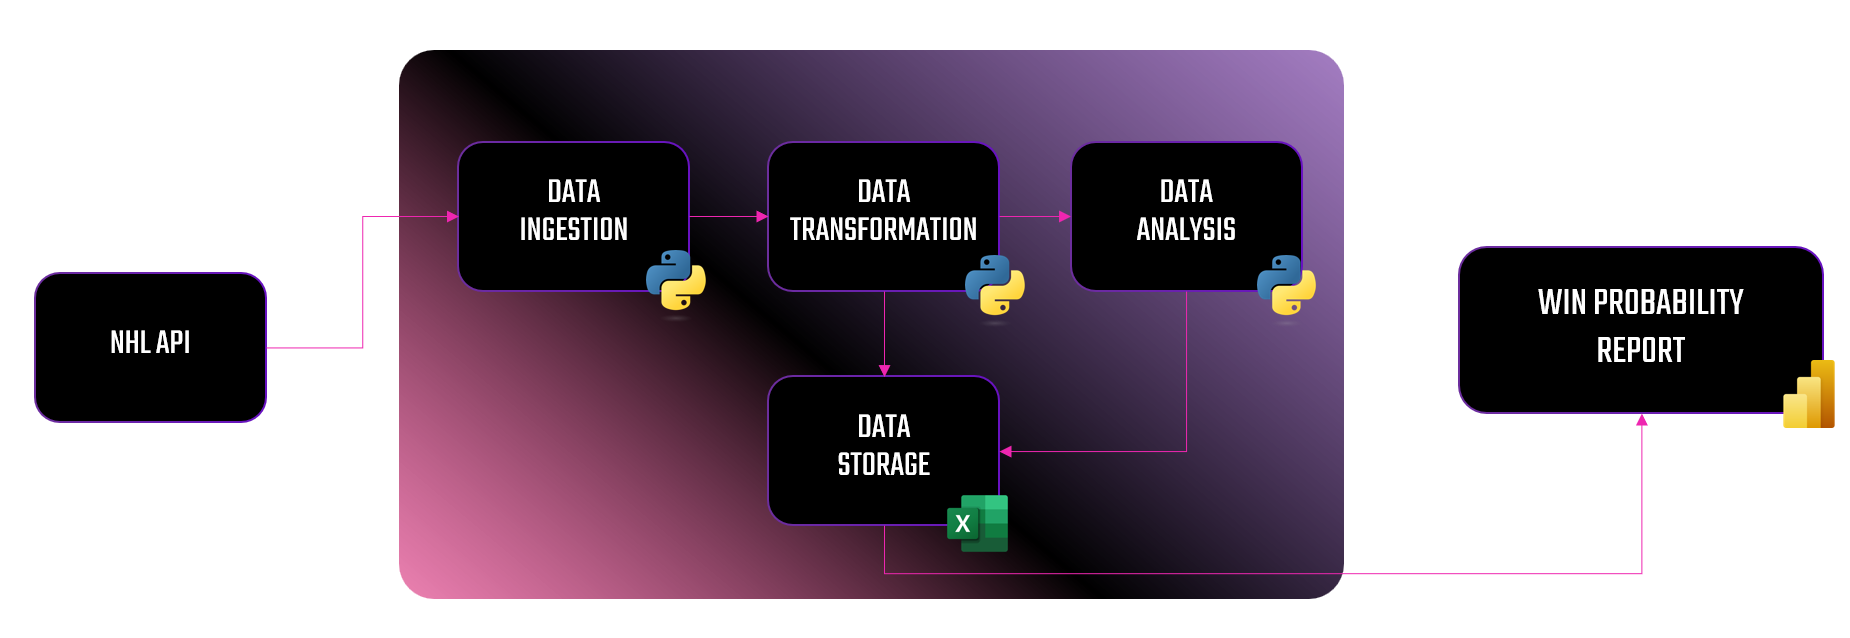
In this week's newsletter, we're going to put on our data engineer hat and build a homemade data pipeline. We'll use the NHL API as our data provider and build a basic data pipeline that results in a Win Probability (WP) report. The WP report will give you a view of each NHL team along with their Expected Win Percentage and Actual Win Percentage, so you can find the value teams on a daily basis. The below illustrates what we'll build out.
Assuming this is your first data pipeline:
- We'll keep everything deployed to your local computer. (You can always migrate the code to the Cloud on your own.)
- We're going to use Python in the pipeline. (You'll likely have to manage Python and R in the real world.)
- We'll have an execution script that runs all of the Python files, and you can schedule yours to run once a day to get the latest scores for your report.
If you want to skip the reading and jump to a quick-hit video, check out the below!
Key Steps to Build a Basic Data Pipeline
In our data pipeline, we'll have five steps:
- Data Ingestion
- Data Transformation
- Data Storage
- Data Analysis & Reporting
- Data Automation & Scheduling
Let's walk through each of these.
Data Ingestion
The first step in any data pipeline is the ingestion of the data. This is the point where raw data meets the beginning of the system that is ingesting the data. In some cases, this is a simple ingestion mechanism (e.g., calling a single data provider), but more realistically there are multiple data sources with different data types.
A few examples of the types of data sources you may come across are as follows:
- APIs (e.g., NHL API for hockey analytics)
- Databases (SQL, NoSQL)
- Streaming services (real-time game updates)
- CSV/Excel files
- Web scraping
In this walkthrough, we'll use the NHL API as the data provider.
Data Transformation
This step is where you clean, format and structure the raw data. This can be a time-consuming and potentially error-prone step. For example, we prefer to use a certain standard when naming columns, so we generally clean up headers at this stage.
Here are some common transformations you might implement at this step:
- Handling missing data (filling gaps or removing incomplete records).
- Converting data types (e.g., converting time-on-ice from
mm:ssto seconds). - Calculating new metrics (e.g., Pythagorean Win Probability).
In this week's example, we'll calculate the Expected Win Probability at this stage.
Data Storage
After you transform the data, you'll want to store it in a place where you can access it for further analysis. This can be, for example, on your local machine, on a server or in the Cloud. It can also be file systems or databases.
Specific storage options are:
- Databases (PostgreSQL, MySQL, SQLite)
- Data warehouses (BigQuery, Snowflake, Redshift)
- CSV/JSON files for lightweight analysis.
In this week's walkthrough, we'll save the transformed dataset as a CSV file on our local machine.
Data Analysis & Reporting
After you've prepped and stored the data, you can now use it to generate insights.
Some common analysis tasks are as follows:
- Computing expected vs. actual win percentage.
- Identifying DFS value players based on analytics.
- Visualizing trends in team performance.
In this week's example, we'll create a report using the Expected and Actual Win Percentage values in Power BI.
Data Automation & Scheduling
Lastly, you'll likely want to automate the data pipeline. Depending on your data architecture, you can create a scheduled job to run at a specific time. For example, if you're building a data pipeline where you only need updated game scores, then you can schedule the data pipeline to refresh once daily.
The types of tools used for automation are as follows:
- You can use cron jobs (Linux/macOS) or Task Scheduler (Windows) for scheduled runs.
- Airflow for complex pipelines.
- AWS Lambda or Azure Functions for Cloud-based automation.
Walkthrough: Building Your First Data Pipeline
The goal of this walkthrough is to create a data pipeline that gives you a daily Win Probability report. The report can be used to highlight 1) value picks and 2) teams that might perform better on home ice.
For this walkthrough, we're going to simulate a data pipeline across most of the steps described earlier. To do this, you'll first create a new folder on your local computer, e.g. data_pipeline, and you'll add two sub-folders to this root folder: data and report. (Note that if you created a new folder and unzipped the code, then you'll already have the data and report folders.)
The Python scripts will live in the root folder (data_pipeline), the data files will live in the data folder, and the final Power BI report will live in the report folder.
Data Ingestion
We're going to leverage the NHL API, specifically calling the following endpoint that will return team standings with some high-level statistics, e.g., https://api-web.nhle.com/v1/standings/2025-02-02. Create a Python file that will execute in the root folder using the following code.
This Python code appends the NHL API with the current date (to get the latest results for that day), retrieves the standings from the return JSON object, recasts the column headings, and saves the resulting file as a CSV data file in the data folder.
import requests
import pandas as pd
from datetime import datetime

current_date = datetime.today().strftime('%Y-%m-%d')

nhl_api_url = f"https://api-web.nhle.com/v1/standings/{current_date}"

response = requests.get(nhl_api_url)

if response.status_code == 200:
    data = response.json()
else:
    print(f"Error: Unable to fetch data (Status Code {response.status_code})")
    exit()

nhl_teams_data = data.get("standings", [])

nhl_team_stats_df = pd.json_normalize(nhl_teams_data)

nhl_team_stats_df.rename(columns={
    "conferenceAbbrev": "CONF",
    "conferenceHomeSequence": "CONF_HOME",
    "conferenceL10Sequence": "CONF_L10",
    "conferenceName": "CONF_NAME",
    "conferenceRoadSequence": "CONF_ROAD",
    "conferenceSequence": "CONF_SEQ",
    "date": "DATE",
    "divisionAbbrev": "DIV_ABBR",
    "divisionHomeSequence": "DIV_HOME",
    "divisionL10Sequence": "DIV_L10",
    "divisionName":"DIV_NAME",
    "divisionRoadSequence":"DIV_ROAD",
    "divisionSequence":"DIV_SEQ",
    "gameTypeId":"GAME_TYPE_ID",
    "gamesPlayed":"GP",
    "goalDifferential":"G_DIFF",
    "goalDifferentialPctg":"G_DIFF_PCT",
    "goalAgainst":"GA",
    "goalFor":"GF",
    "goalsForPctg":"GF_PCT",
    "homeGamesPlayed":"HOME_GAMES",
    "homeGoalDifferential":"HOME_G_DIFF",
    "homeGoalsAgainst":"HOME_GA",
    "homeGoalsFor":"HOME_GF",
    "homeLosses":"HOME_LOSSES",
    "homeOtLosses":"HOME_OT_LOSSES",
    "homePoints":"HOME_PTS",
    "homeRegulationPlusOtWins":"HOME_REG_PLUS_OT_W",
    "homeRegulationWins":"HOME_REG_W",
    "homeTies":"HOME_TIES",
    "homeWins":"HOME_WINS",
    "l10GamesPlayed":"L10_GP",
    "l10GoalDifferential":"L10_G_DIFF",
    "l10GoalsAgainst":"L10_GA",
    "l10GoalsFor":"L10_GF",
    "l10Losses":"L10_L",
    "l10OtLosses":"L100T_L",
    "l10Points":"L10_PTS",
    "l10RegulationPlusOtWins":"L10_REG_P_OT_W",
    "l10RegulationWins":"L10_REG_T",
    "l10Ties":"L10_T",
    "l10Wins":"L10_W",
    "leagueHomeSequence":"LEAGUE_HOME_SEQ",
    "leagueL10Sequence":"LEAGUE_L10_SEQ",
    "leagueRoadSequence":"LEAGUE_RD_SEQ",
    "leagueSequence":"LEAGUE_SEQ",
    "losses":"L",
    "otLosses":"OT_L",
    "pointPctg":"PT_PCT",
    "points":"PTS",
    "regulationPlusOtWinPctg":"REG_PLUS_OT_W_PCT",
    "regulationPlusOtWins":"REG_PLUS_OT_W",
    "regulationWinPctg":"REG_W_PCT",
    "regulationWins":"REG_W",
    "roadGamesPlayed":"ROAD_GP",
    "roadGoalDifferential":"ROAD_G_DIFF",
    "roadGoalsAgainst":"ROAD_GA",
    "roadGoalsFor":"ROAD_GF",
    "roadLosses":"ROAD_L",
    "roadOtLosses":"ROAD_OT_L",
    "roadPoints":"ROAD_PTS",
    "roadRegulationPlusOtWins":"ROAD_REG_PLUS_OT_W",
    "roadRegulationWins":"ROAD_REG_W",
    "roadTies":"ROAD_T",
    "roadWins":"ROAD_W",
    "seasonId":"SEASON_ID",
    "shootoutLosses":"SO_L",
    "shootoutWins":"SO_W",
    "streakCode":"STREAK_CODE",
    "streakCount":"STREAK_COUNT",
    "teamLogo":"TEAM_LOGO",
    "ties":"TIES",
    "waiversSequence":"WAIV_SEQ",
    "wildcardSequence":"WILD_CARD_SEQ",
    "winPctg":"WIN_PCT",
    "wins":"W",
    "placeName.default":"CITY",
    "teamName.default":"TEAM_NAME",
    "teamName.fr":"TEAM_NAME_FR",
    "teamCommonName.default":"TEAM_COMMON_NAME",
    "teamAbbrev.default":"TEAM_ABBR",
    "placeName.fr":"PLACE_NAME_FR",
    "teamCommonName.fr":"TEAM_COMMON_NAME_FR"

}, inplace=True)

csv_file_path = "data/nhl_team_stats_and_standings.csv"
nhl_team_stats_df.to_csv(csv_file_path, index=False)

print(f"Team Stats & Standings file has been saved successfully: {csv_file_path}")
At this point, you've ingested the team standings data, so the next step is to transform the data and ready it for analysis.
Data Transformation
There isn't too much data in this example, so to transform the data we'll do two things:
- We'll filter the dataset for only those columns that we need; and
- We'll add some calculated columns that we'll need for analysis.
Add another Python file into the root folder with the following code.
This code loads the original dataset ingested via the NHL API, filters the dataset, adds three columns to this newly filtered data frame, and then saves the resulting data frame as a new CSV in the data folder.
import pandas as pd

team_stats_df = pd.read_csv("data/nhl_team_stats_and_standings.csv")

transformed_df = team_stats_df[['TEAM_NAME', 'TEAM_ABBR', 'GP', 'W', 'L', 'OT_L',
                                'PTS', 'PT_PCT', 'WIN_PCT', 'GF', 'GA',
                                'HOME_GA', 'HOME_GF', 'ROAD_GA', 'ROAD_GF']]

transformed_df['EXP_WIN_PCT'] = transformed_df['GF']**2 / (transformed_df['GF']**2 + transformed_df['GA']**2)

transformed_df['EXP_HOME_WIN_PCT'] = transformed_df['HOME_GF']**2 / (transformed_df['HOME_GF']**2 + transformed_df['HOME_GA']**2)

transformed_df['EXP_AWAY_WIN_PCT'] = transformed_df['ROAD_GF']**2 / (transformed_df['ROAD_GF']**2 + transformed_df['ROAD_GA']**2)

csv_file_path = "data/win_percentage_team_data.csv"
transformed_df.to_csv(csv_file_path, index=False)
Data Storage
All of our data in this walkthrough is stored in the data folder. At this point, the dataset we're going to use for the analysis is stored and ready for use. There's not much more at this step, other than to realize that every time the pipeline is run, the data in this folder will be updated. The data, below, is what you should see when you open the win_percentage_team_data.csv file.
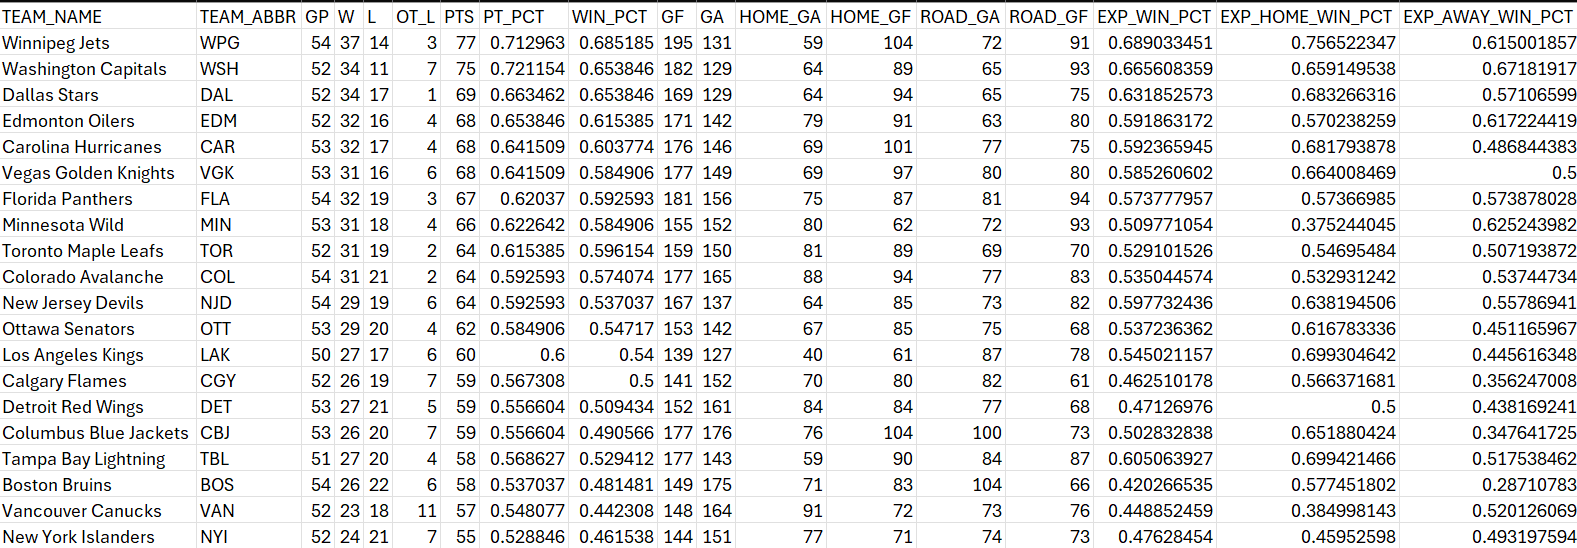
At this point, you can now use this file for data analysis.
Data Analysis
As mentioned earlier, we want a report that 1) highlights the teams that have the best Expected and Actual Win Percentage and 2) ranks the teams with the best Expected Win Percentage when playing on home ice. We can use these two bits of information to help us make decisions around value teams that may have an advantage playing at home.
To do this, we'll create a third Python file with the following code.
The code is straightforward. It creates a data frame from the win_percentage_team_data.csv file. It then creates two variables (VALUE_DIFF and HOME_AWAY_DIFF), which we can use as key variables in our report. Two separate files are then created, which you'll use for the final reporting step.
import pandas as pd

wp_df = pd.read_csv("data/win_percentage_team_data.csv")

wp_df["VALUE_DIFF"] = wp_df["WIN_PCT"] - wp_df["EXP_WIN_PCT"]
wp_df["HOME_AWAY_DIFF"] = wp_df["EXP_HOME_WIN_PCT"] - wp_df["EXP_AWAY_WIN_PCT"]

value_picks = wp_df[["TEAM_NAME", "WIN_PCT", "EXP_WIN_PCT", "VALUE_DIFF"]].sort_values(by="VALUE_DIFF", ascending=False)

value_picks.to_csv("data/nhl_value_picks.csv", index=False)

home_vs_away = wp_df[["TEAM_NAME", "EXP_HOME_WIN_PCT", "EXP_AWAY_WIN_PCT", "HOME_AWAY_DIFF"]].sort_values(by="HOME_AWAY_DIFF", ascending=False)

home_vs_away.to_csv("data/home_vs_away.csv", index=False)
At this point, we now have two files: nhl_value_picks.csv and home_vs_away.csv, which we can use to create the final report, both of which live in the data folder.
Reporting
We'll build the final report in Microsoft Power BI, comprising two reports:
- Expected Win Percentage - Home vs Away
- Expected Win Percentage vs Actual Win Percentage
With these two reports, we should be able to find some value picks such as teams who are expected to win more at home than away or teams that may be over- or under-performing.
To start, create a new Power BI project and save it in the report folder. We'll need to add both CSV files created in the last step to Power BI. To do this:
- Open the newly created Power BI file.
- Click Get data, select Text/CSV and navigate to the files and click Load.
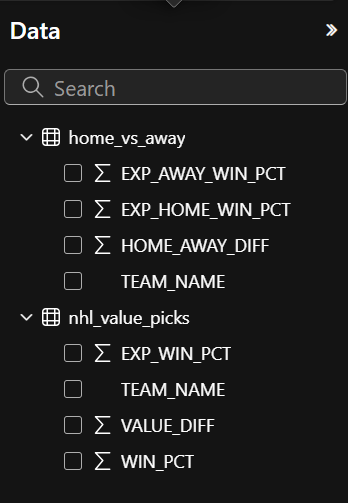
The CSV files will be loaded as data models into Power BI, and you should now find them under the Data pane.
You can now create the two reports.
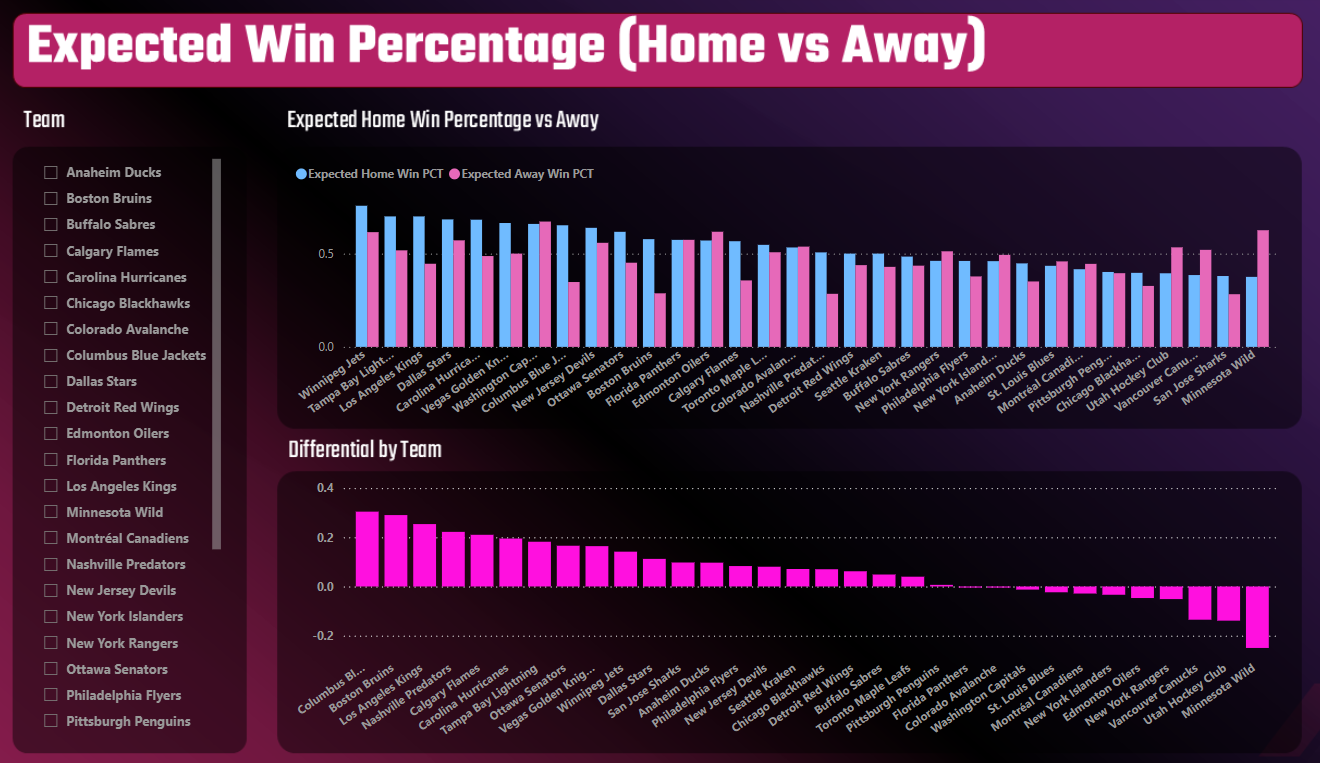
The first report, Expected Win Percentage (Home vs Away), has three controls:
- One Slicer control as a filter for the teams; and
- Two Clustered column charts, one to compare home versus away Win Percentages and another for the differential.
The resulting report is below. The key takeaway from the chart is to find the teams with the higher Expected Win Percentages when playing at home and with a differential that is positive towards home ice. For example, Winnipeg, Tampa Bay and Los Angeles all have higher Expected Win Percentages when playing at home.
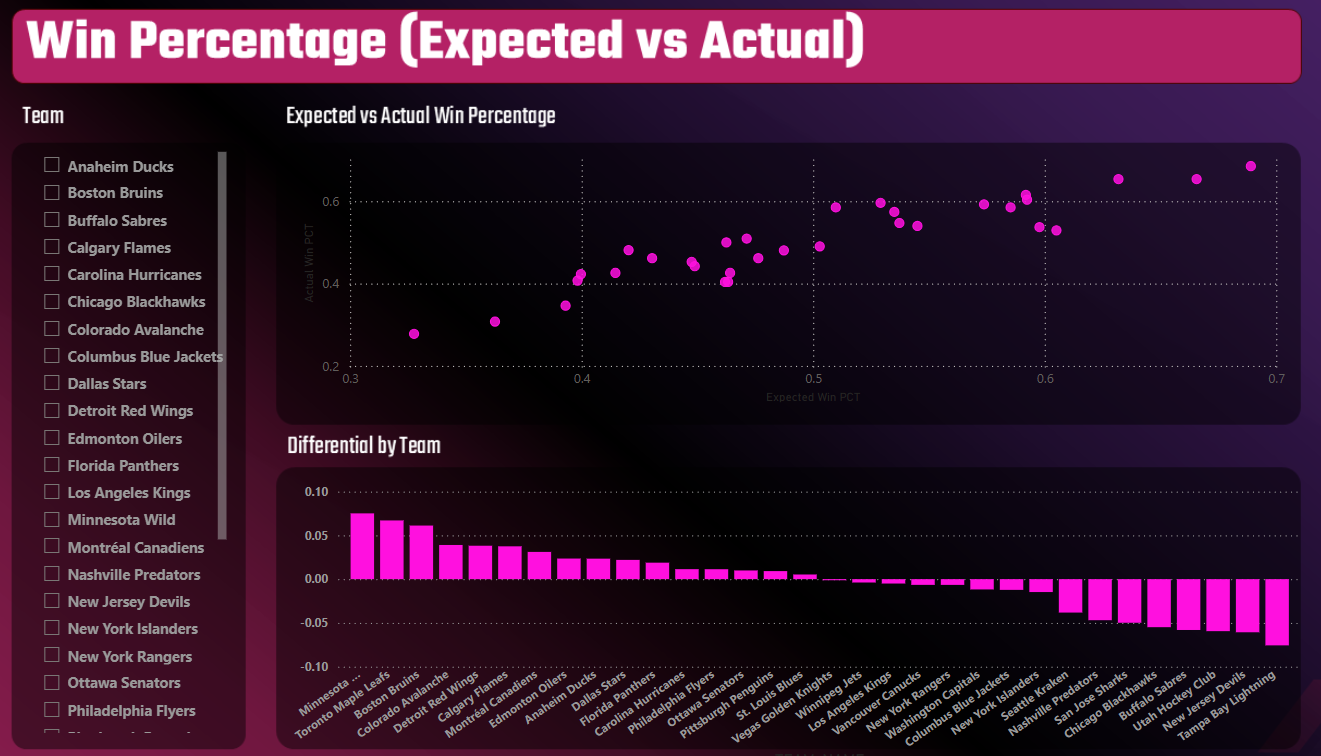
The second report, Win Percentage (Expected vs Actual), also has three controls:
- One Slicer control for the teams;
- One Scatter chart to plot Expected and Actual Win Percentages; and
- One Clustered column chart to plot the differential between Expected and Actual Win Percentage.
If a team is on towards the upper right-hand side of the Scatter chart, then you can validate whether the team is over- or under-performing by virtue of their differential. For example, a team like Winnipeg is performing well and as expected; their Expected and Actual Win Percentage are the same, and the differential is 0.
Automation & Scheduling
The final piece of the data pipeline puzzle is the automation and scheduling. We would want to run this script each morning at 9AM Eastern. At this time, all of the scores would be recorded from the night before, and we could create a report that would allow us to validate our decisions against the daily over/under and Money line.
We'll keep the automation simple by creating an execution script that calls the three Python scripts you've written and executes them in sequence – stored alongside the other Python scripts in the root folder. Running this once a day at 9AM Eastern would be classified as a "batch" process. It's a small batch process, but one nonetheless.
import subprocess

ingestion_script = "1_get_team_statistics.py"
transform_script = "2_transform_team_stats.py"
analysis_script = "3_data_analysis_prep.py"

subprocess.run(["python", ingestion_script])
print("Getting NHL Team Stats Data.")

subprocess.run(["python", transform_script])
print("Transforming NHL Team Stats Data for Win Percentage Reports.")

subprocess.run(["python", analysis_script])
print("Preparing NHL Win Percentage Files for Analysis.")
You can then schedule this Python script to run every day, and when you open the Power BI report, simply click the Refresh button, and the latest data from your data pipeline will flow into the report.
Summary
In this week's newsletter, we went deep on data pipelines. We first explored what a data pipeline is and the different steps that make one up, and then we walked through how to create a basic data pipeline using Python.
The goal of the data pipeline was to create a refreshable report, which you can use to track the Expected and Actual Win Percentage of NHL hockey teams – using the NHL API. If you're into DFS or sports betting, this type of report (and the ability to create a homemade data pipeline that gives you updated data on a daily basis) will help with your decision-making process.
Subscribe to our newsletter to get the latest and greatest content on all things hockey analytics!
Member discussion