Overview of Goals Versus Threshold

In this Edition
- What is Goals Versus Threshold?
- How Do You Calculate GVT?
- Sample GVT Analysis
What is Goals Versus Threshold?
Goals Versus Threshold, or GVT, is an advanced statistic designed to evaluate a player's overall contribution to their team's success by quantifying how many goals they add or subtract from the team compared to a threshold. GVT is typically used to evaluate players on a team vis-a-vis the concept of replacement players – but it can also be used at the league level. In this context, you're evaluating against a threshold called replacement level. According to Vollman, Awad and Fyffe (from Stat Shot):
When a player leaves an organization, for whatever reason, the team doesn’t play a man short— the departing player is immediately replaced with someone else. Similarly, a newly acquired player will push his weakest new teammate out of the lineup. That’s why a player’s value shouldn’t be measured relative to zero or the league average but to the difference between him and the next-best available hockey player at his position. That’s a concept generally referred to as replacement level. (p. 26)
The replacement level is very dynamic; it increases or decreases depending on the team's talent. For example, if a team is doing well and scoring a lot of goals, then their GVT is higher. If they are not scoring goals, then they're GVT is lower. Vollman, Awad and Fyffe add that:
GVT presents a player’s value not in absolute terms and not relative to the league average but in terms of how well the team would perform in his absence. That is a key concept and exactly what the VT stands for in GVT (i.e., versus a threshold). (p. 28)
Note that the replacement threshold can be represented at the team level and at the league level. Thus, threshold can be measured in different ways with granularity and filters applied to the data. For example, you may want to calculate the threshold to represent all centers on a team if you're measuring against an incoming centerman. Or, you could calculate the league average and filter for defensemen.
Here's a breakdown of its usefulness, pros, and cons of the GVT statistic.
Usefulness
- Comprehensive Evaluation: GVT considers various aspects of a player's performance, including offense, defense, and special teams play. This makes it a more comprehensive metric than simply looking at goals or points scored.
- Comparative Analysis: GVT allows for easy comparison between players across different positions and roles within a team. It provides a standardized measure to assess player value regardless of their specific responsibilities.
- Predictive Value: Teams and analysts can use GVT to predict a player's impact on future performance or to evaluate potential trades or signings.
Pros
- Holistic View: GVT takes into account multiple aspects of a player's game, offering a more holistic view of their contribution than traditional stats.
- Standardization: Since GVT is a standardized metric, it's easier to compare players across teams and seasons.
- Predictive: It can help predict future performance based on historical data, aiding teams in decision-making.
Cons
- Complexity: GVT calculations can be complex, involving various statistical models and formulas. This complexity might make it less accessible to casual fans or those unfamiliar with advanced hockey analytics.
- Data Availability: GVT relies on a wide range of data, including play-by-play statistics and situational information, which may not always be readily available or consistently recorded.
- Subjectivity: Like any advanced stat, GVT requires certain assumptions and subjective decisions in its calculations, which can introduce biases or inaccuracies.
Overall, GVT is a useful tool for assessing player performance, offering a more nuanced view compared to traditional stats. However, its complexity and reliance on specific data sources can be limitations that need to be considered when using it for analysis or decision-making.
How Do You Calculate GVT?
Calculating GVT involves four steps and requires specific data to be collected. The formula for GVT can vary slightly depending on the source or methodology used, but here's a general overview of the steps involved.
- Calculate Offensive GVT (OGVT)
- Calculate Defensive GVT (DGVT)
- Calculate Special Teams GVT (SGVT)
- Add OGVT, DGVT and SGVT
Let's walk through each one of the above.
Offensive GVT (OGVT)
Start by calculating the player's offensive goals above replacement (OGAR).This involves considering factors like goals scored, assists, shots on goal, power play goals, and other offensive contributions. The formula for OGAR might include weights for different statistics based on their impact on goal scoring.
Next, calculate the player's offensive goals above average (OGAA). This accounts for the player's offensive production compared to the team or league average, adjusting for factors like ice time and team performance.
Finally, subtract the offensive threshold (OT) from the player's OGAA to get the Offensive GVT. The formula for this is: OGVT = OGAA - OT.
Defensive GVT (DGVT)
Calculate the player's defensive goals above replacement (DGAR). This considers factors such as blocked shots, takeaways, hits, penalty killing effectiveness, and other defensive contributions.
Calculate the player's defensive goals above average (DGAA), which compares their defensive performance to the league average, adjusting for ice time and team performance.
Subtract the defensive threshold (DT) from the player's DGAA to get the Defensive GVT. The formula for this is: DGVT = DGAA - DT.
Special Teams GVT (SGVT)
Similar to offensive and defensive GVT, calculate the player's goals above replacement and goals above average for special teams play, considering power play goals, penalty kill effectiveness, and other special teams contributions.
Subtract the special teams threshold (ST) from the player's special teams GAA to get the Special Teams GVT. The formula for this is: SGVT = SGAA - ST.
Total GVT
The final step is to add up the Offensive GVT, Defensive GVT, and Special Teams GVT to get the player's Total GVT. The formula for this is: GVT = OGVT + DGVT + ST.
As for the data needed to calculate GVT, it typically includes detailed player statistics such as goals, assists, shots on goal, blocked shots, takeaways, hits, power play goals, penalty kill effectiveness, ice time, team performance metrics, and more. This data is often obtained from play-by-play records, game summaries, and other sources that provide comprehensive player performance information.
For an in-depth and practical walkthrough of GVT, check out the following article along with a sample dataset.
Sample GVT Analysis
Employing the GVT approach, we took a sample of data for three consecutive seasons to test out GVT. We calculated the replacement level using league as our replacement context, so used league average in our calculations of the GVT statistic.
We sourced the data from Hockey-Reference and evaluated the GVT to answer four questions:
- How did GVT change across the three seasons?
- What is the distribution of GVT across players and teams?
- What are the differences of GVT across different positions?
- What is the relationship between GVT and other hockey statistics?
We present some of our findings below.
Summary Statistics
Across the three seasons worth of data, we observed the following summary statistics:
- Minimum: 0
- Maximum: 1
- Mean: 0.1193
- Median: 0.0763
- Standard Deviation: 0.1079
Given the data was normalized, the minimum of 0 and maximum of 1 were expected.
The mean, however, is significantly lower than the maximum. This suggests that while there are values at the upper end, most of the data points are skewed towards the lower end of the scale. The median being less than the mean (0.0763 vs 0.1193) reinforces the idea of a right-skewed distribution. This indicates that more than half of the values are lower than the mean, and the data distribution is not symmetrical but skewed towards lower values.
The standard deviation measures the amount of variation or dispersion in the data. A standard deviation of 0.1079, relative to the mean of 0.1193, indicates a moderate level of variability. Given the range of 0 to 1, this standard deviation suggests that while there are deviations around the mean, most of the data points are relatively close to the mean, reinforcing the presence of many values clustered towards the lower end of the range.
Difference of GVT across Seasons
For this calculation, we didn't filter out any positions or any players across all seasons. So, the bel0w visualization represents all positions across three years worth of statistical data.
Interestingly, we found that GVT (which we normalized between 0 and 1) to increase year-over-year. The 2022-2023 season was a significant increase over the 2021-2022 season; however, the 2022-2023 and 2023-2024 seasons were much closer.
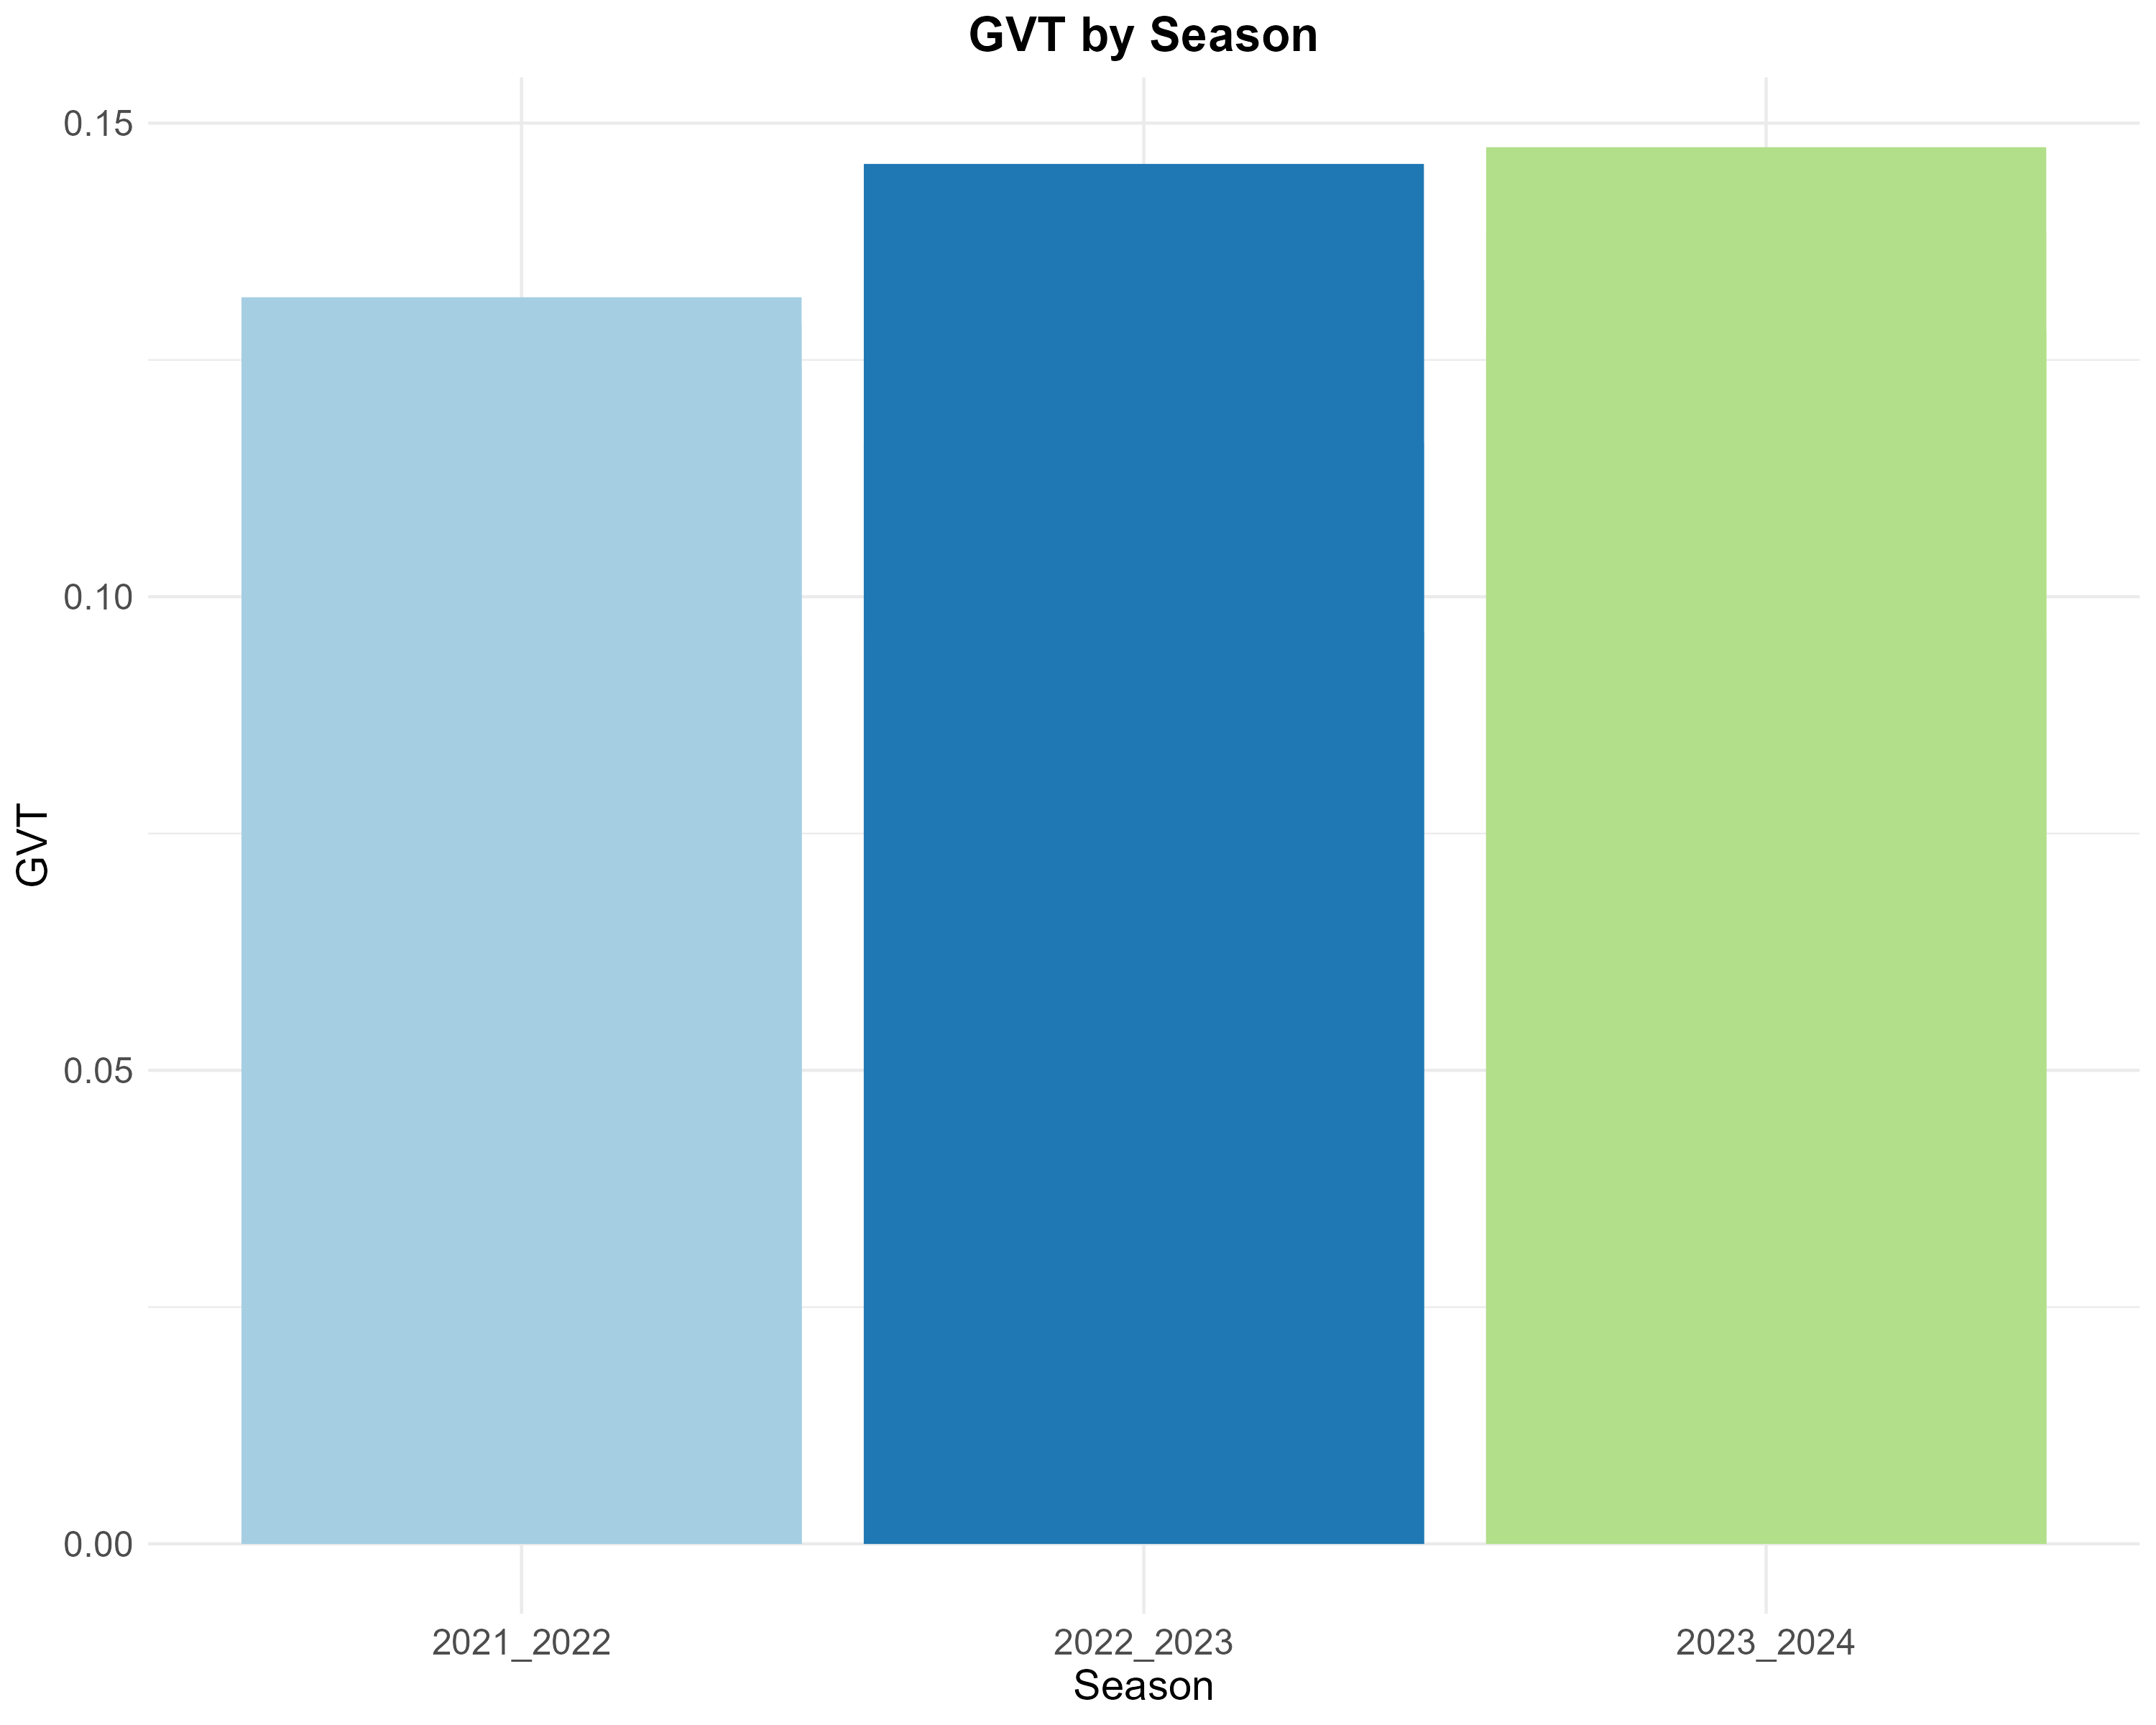
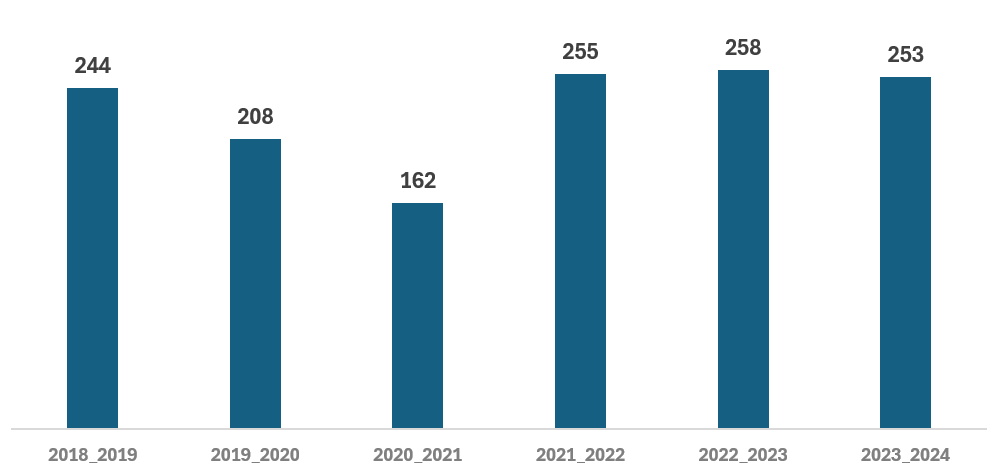
This was interesting because if you plot average goals scored across seasons, they seem consistent across the above three seasons. Of course, COVID introduced anomalies for previous seasons. So, we can only surmise that there may be some other issues at play that are factors within GVT for the 2021-2022 season.
Let's move onto the distribution of GVT across players.
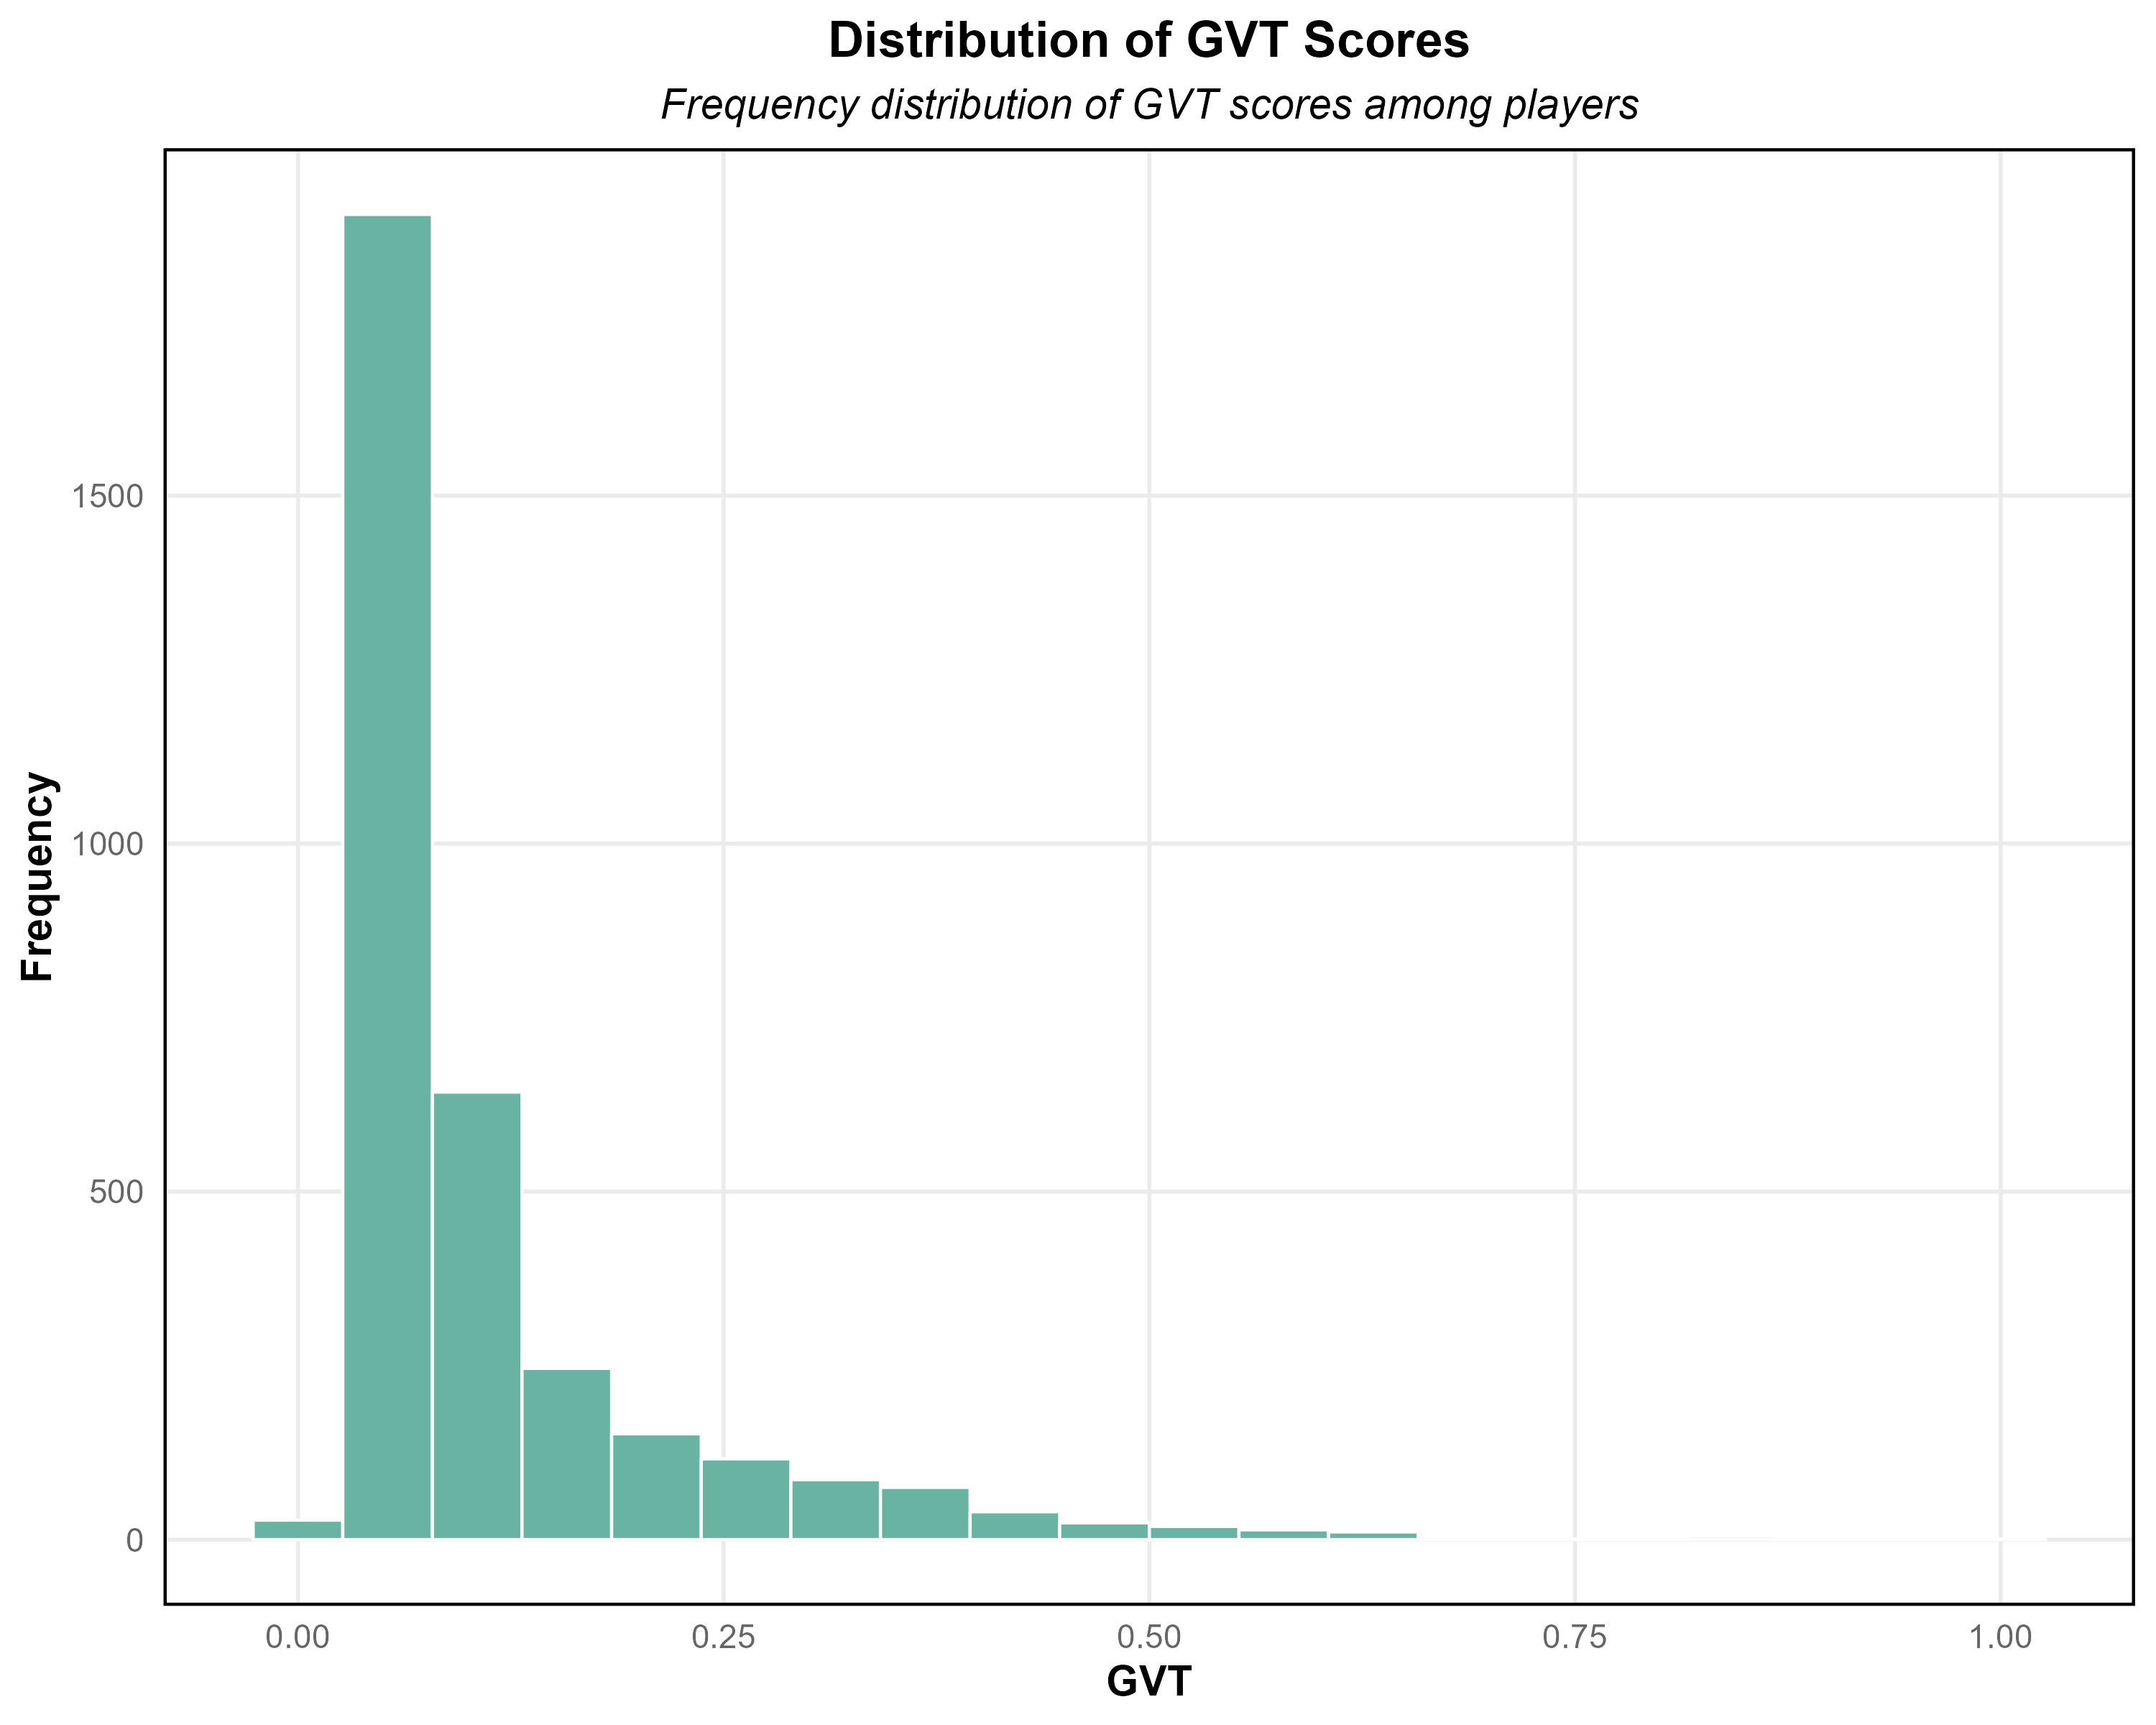
Distribution of GVT across Players
The findings of the distribution reinforce our summary statistics. That is, the distribution skews right and there is a cluster of GVT scores towards the lower end of the spectrum. Note that this is consistent with other analyses we've done, where we've seen a lower percentage of higher-scoring players that drive the skew. For example, in the 2023-2024 season, only 8.7% of players scored 25 goals or more.
Let's now look at the difference of GVT across positions.
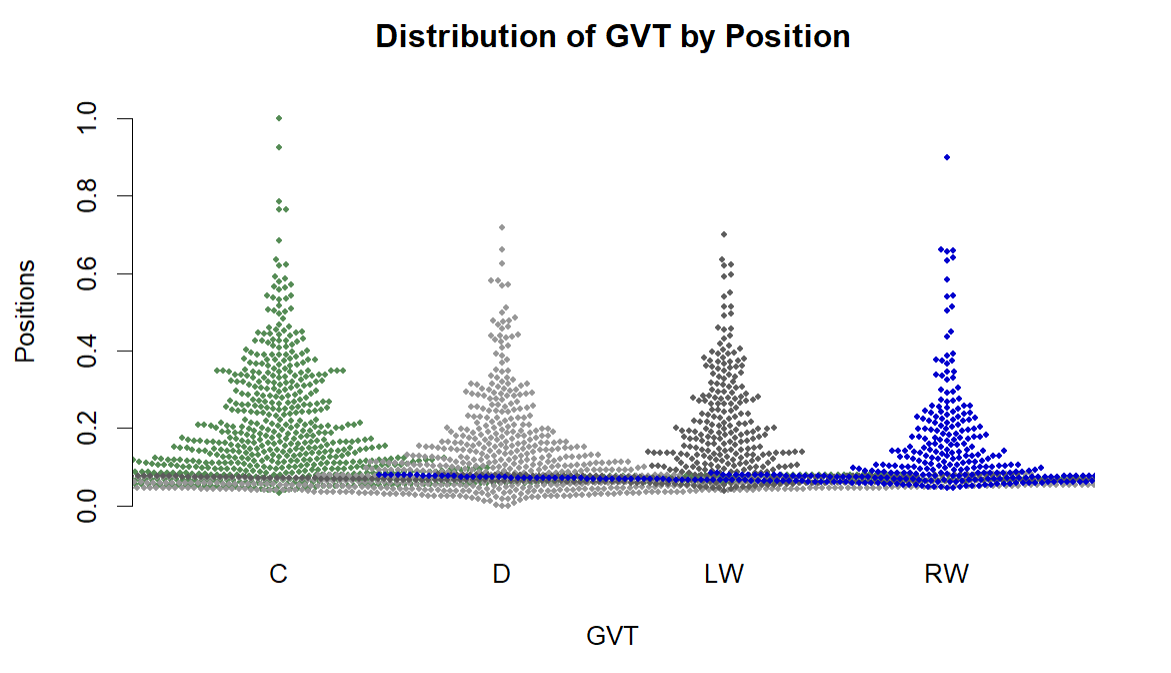
Difference of GVT across Position
For this visualization, we chose to use a bee swarm chart. This is different from a histogram because the individual points give you a better sense of the spread of data across each position along with any outliers. For example, here we can see that centermen have a higher GVT score along with more outliers than the other positions. Interestingly, defense looks strong, but again this is because of the nature of the statistics that are included within the GVT.
Let's finally look at some at the relationship between GVT and other hockey statistics.
Exploring GVT and Other Hockey Statistics
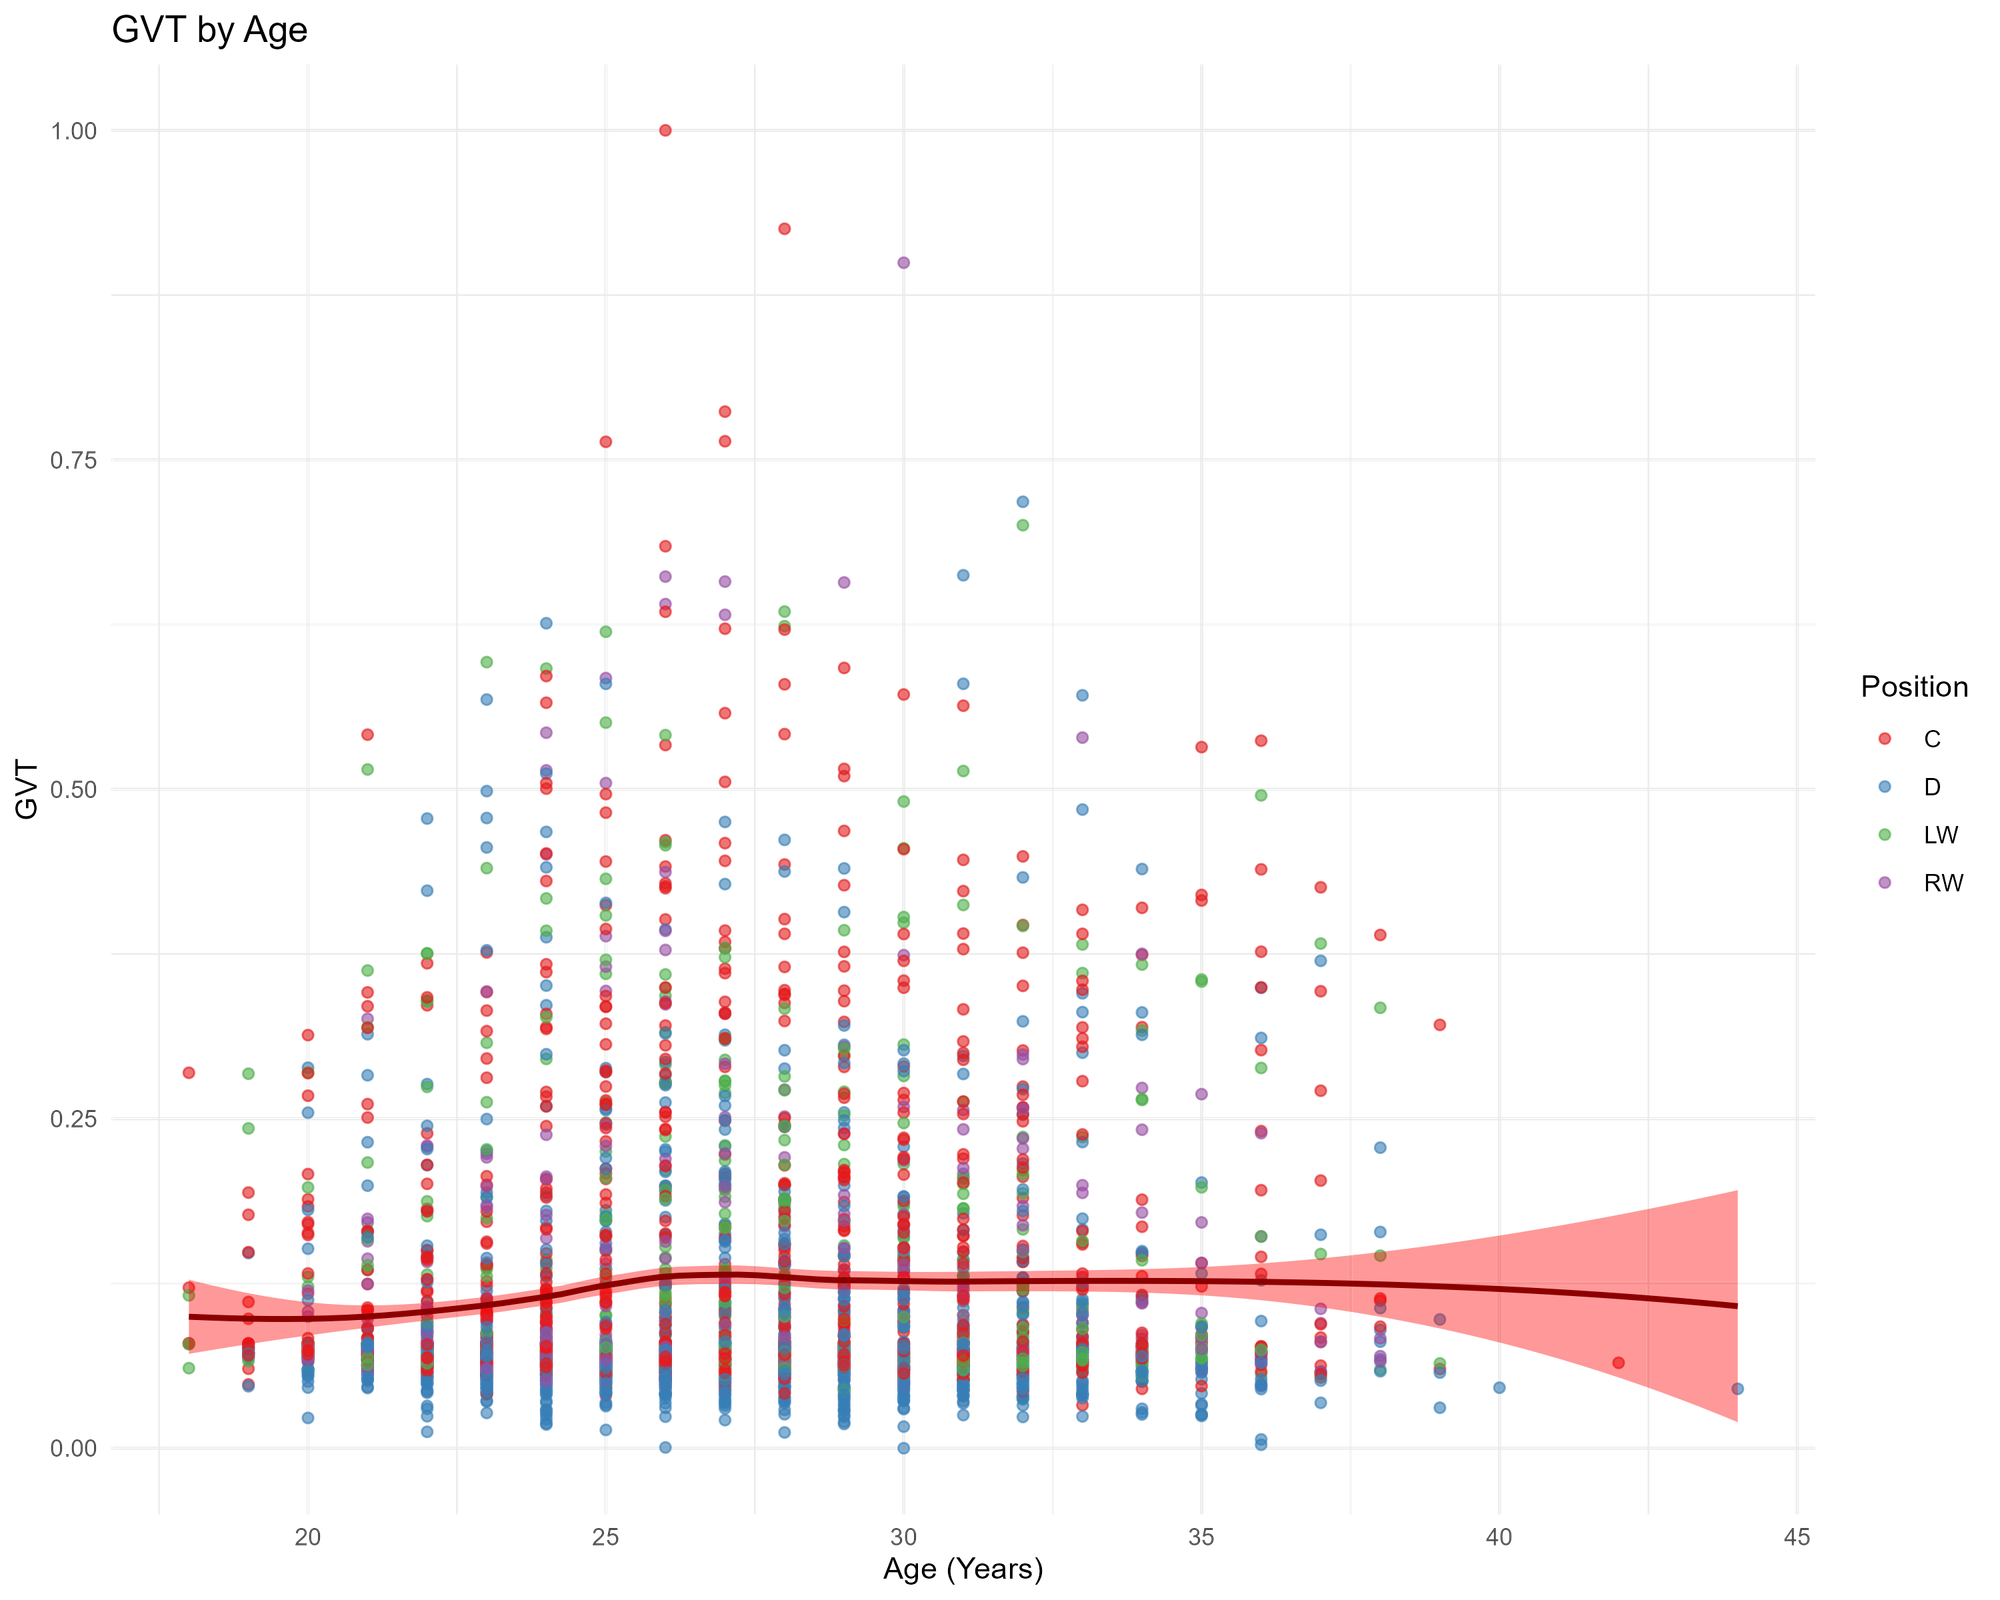
Given draft season is upon us, we wanted to first see if there was any positive or negative relationships between age and GVT. The below visualization considers all positions across the three seasons worth of data and plots it against age. While no explicit trendline emerged within the visualization, the existence of a bell curve is telling. This implies lower GVT scores for younger and older players.
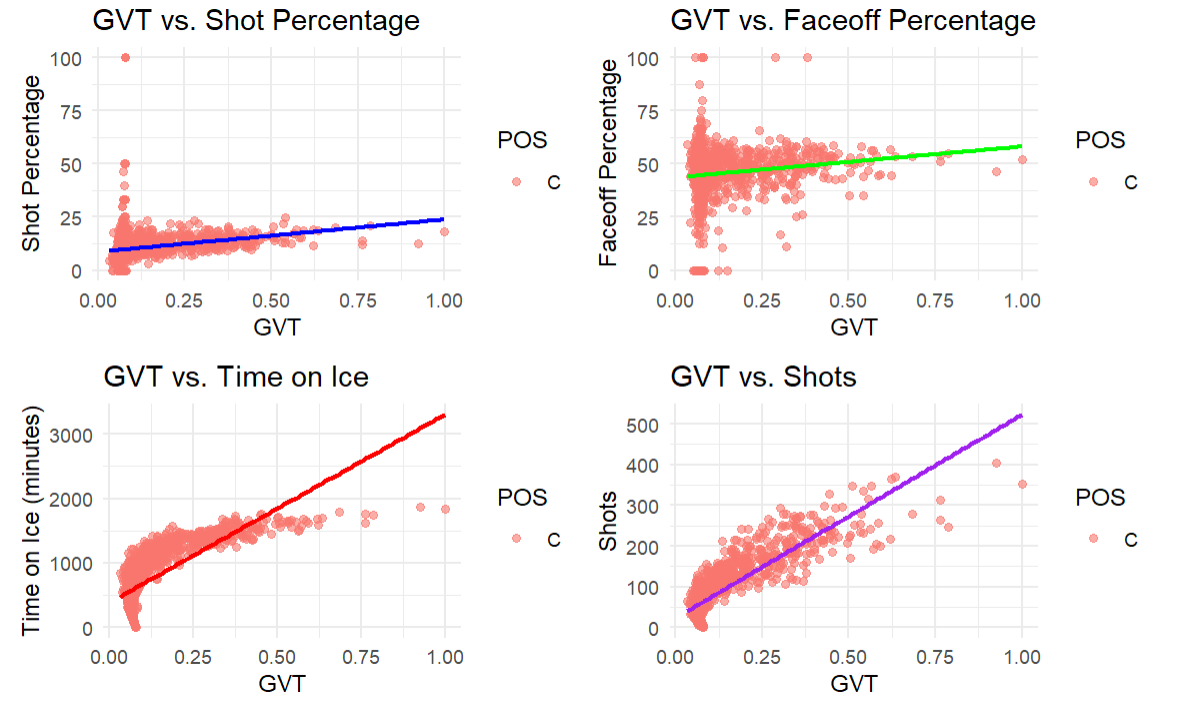
We then looked at several other factors, such as shot percentage, faceoff percentage, time on ice, and shots. Time on ice and shots exhibited positive correlations. Time on ice made sense, since the more time you spend on ice the more chances you get, as did shots – you don't score if you don't shoot.
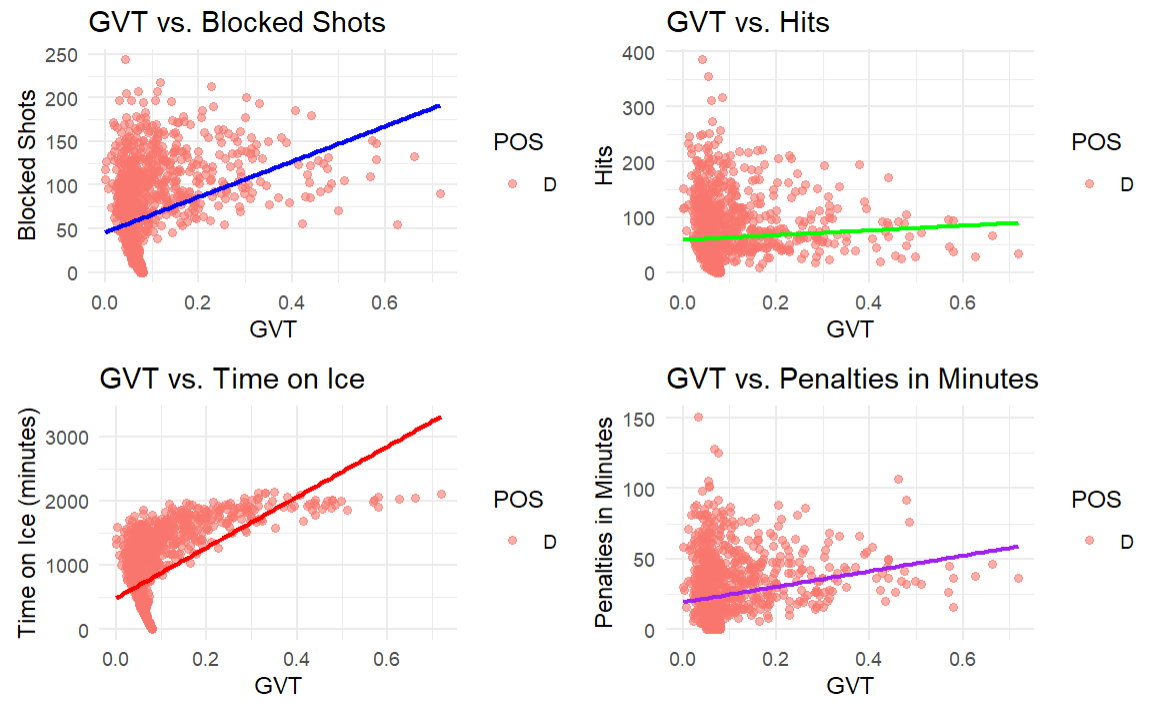
We also tested a few others and found varying results in the relationships. Across these other statistics, hits were neutral, PIM had a slightly positive relationship, and blocked shots and time on ice had stronger positive relationship.
All told, GVT is an interesting, but somewhat complex statistic. You can use it to evaluate players across the team and league level, but we wouldn't necessarily recommend it for armchair analyses – there are simpler ways to analyze player contribution and performance.
Summary
In this newsletter edition, we introduced you to Goals Versus Threshold (GVT), a composite statistic that measures actual and potential contribution vis-a-vis a replacement threshold. The replacement threshold can be calculated at different levels – e.g., team or league level.
We walked through how to calculate GVT and then calculated our own examples to test out three seasons worth of team statistics – using a normalized GVT. We found that the GVT has a right-skewed distribution (meaning a relatively low percentage of players have high GVTs), centermen have a higher GVT than other positions, there is little correlation with age (though there is lower GVTs with younger and older players), and GVT has varying relationships across hockey statistics.
For more information on GVT (and many other advanced hockey statistics), we'd recommend Stat Shot by Vollman, Awad and Fyffe.
Subscribe to our newsletter to get the latest and greatest content on all things hockey analytics!
Member discussion