PDO: How Lucky are Ya?
In this Edition
- What is PDO?
- Why is it Important?
- How does PDO Translate into "Luck"?
- What are Example PDO Reports?
What is PDO?
PDO is a statistical metric that combines a team's Shooting Percentage and its Save Percentage to help evaluate a team's overall performance. It's used to gauge how "lucky" or "unlucky" a team has been over a period of time. The term PDO doesn't stand for anything; it's named after an online hockey enthusiast known as PDO who popularized the metric. According to Joshua Pollock, author of Everything You'll Need to Know about Hockey Analytics, "if you’re wondering if it’s an acronym, you’ll be surprised to know it stands for nothing; its inventor, Brian King, was called PDO online—and it was named after him" (p. 93).
Here's a breakdown of what PDO represents and measures:
- Shooting Percentage (S%): This is the percentage of shots taken by a team that result in goals. A higher shooting percentage suggests that a team is more efficient at converting shots into goals.
- Save Percentage (SV%): This is the percentage of shots on goal that a team's goaltenders save. A higher save percentage indicates better goaltending performance, as more opponent shots are being saved.
PDO is simply calculated by adding a team's Shooting Percentage and Save Percentage:

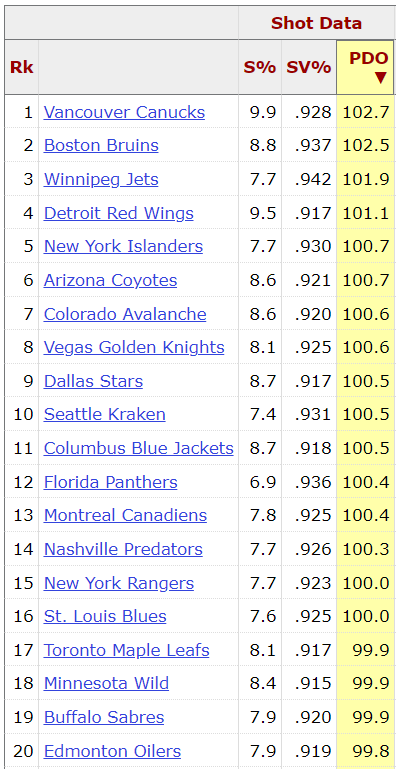
For example, below is an excerpt from a recent team snapshot (Top 20 5 on 5) from Hockey-Reference. You can see the Shooting Percentage and Save Percentage called out, along with the PDO. For Vancouver, the PDO is calculated as follows: 9.9% + 92.8% = 102.7%.
A PDO of 100 is considered average, as it suggests that the team's combined shooting and save percentages are performing at a sustainable level. A PDO above 100 indicates that a team may be experiencing good luck or performing above expectation, possibly due to high shooting accuracy or exceptional goaltending. Conversely, a PDO below 100 might suggest bad luck or underperformance.
PDO can be useful for predicting future performance changes. Teams with exceptionally high or low PDOs are likely to see their performance regress to the mean over time, as shooting and save percentages tend to normalize. This makes PDO a valuable tool for analysts and fans to understand the sustainability of a team's winning or losing streaks beyond just looking at wins and losses.
Why is it Important?
PDO is a valuable metric in hockey analytics for various stakeholders, including team analysts, coaches, hockey enthusiasts, and fantasy hockey players.
Here's why it's used and who can benefit from it.
Why It's Used?
- Performance Sustainability: PDO helps in assessing whether a team's performance is sustainable over the long term. A very high or low PDO might indicate that a team's current performance is influenced significantly by luck, and it's likely to regress to the mean (toward 100) over time.
- Evaluating Luck Factor: It provides insights into the luck factor in a team's winning or losing streaks. This can help in separating skill and performance from fortuitous circumstances.
- Identifying Undervalued Players and Teams: By identifying teams or players with unusually low PDOs (suggesting bad luck), analysts and fans can spot potential for improvement before it becomes apparent in more traditional statistics like goals or wins.
Who Uses PDO?
- Team Analysts and Coaches: They use PDO to evaluate their team's performance and make strategic decisions, such as adjusting line combinations or strategies to influence shooting and save percentages positively.
- Hockey Enthusiasts and Analysts: Fans who enjoy digging into the analytics of the game use PDO to understand the nuances of team performance and to engage in more informed discussions about the sport.
- Fantasy Hockey Players: PDO is particularly useful for fantasy hockey enthusiasts in several ways:
- Drafting Players: By analyzing PDO, fantasy players can identify underperforming players who may be due for a positive regression, making them potential steals in fantasy drafts.
- Trade Decisions: High PDO values might signal that a player is performing at an unsustainably high level, possibly due to luck. This insight can be useful for making timely sell-high trades before a player's performance regresses.
- Waiver Wire Pickups: Players on a team with a low PDO might be underperforming due to bad luck rather than lack of skill. These players can be good candidates for waiver wire pickups, as their performance is likely to improve as their PDO regresses to the mean.
- Goalie Evaluations: Since save percentage is a part of PDO, fantasy players can use PDO to evaluate goalies. A goalie with a low PDO might be facing bad luck with save percentages and could be due for an upswing, making them a valuable addition.
By understanding and applying PDO, fantasy hockey enthusiasts can gain a competitive edge by making more informed decisions that account for the sustainability of player and team performances. This can help in building a more resilient and potentially successful fantasy team.
How does PDO Translate into "Luck"?
The "luck" part of PDO in hockey refers to the idea that the sum of a team's shooting percentage and save percentage can reflect the influence of randomness or luck on a team's performance. Essentially, it's based on the assumption that most teams will regress towards a mean PDO of 100 over time, as shooting and save percentages are subject to variability and can be influenced by factors beyond skill and strategy.
Here's how luck comes into play:
- Shooting Percentage: If a team has an unusually high shooting percentage over a series of games, it might indicate that they've been more lucky than skilled in scoring goals. Shots that might not typically result in goals are finding their way into the net, perhaps due to deflections, poor goaltending on the part of the opponents, or simply good fortune.
- Save Percentage: Similarly, if a team's goaltenders have an exceptionally high save percentage, it could suggest that they've been lucky in stopping shots that might otherwise have resulted in goals. This could be due to facing less challenging shots, opponents hitting the post, or miraculous saves that aren't sustainable over time.
When the PDO value is significantly above 100, it suggests that a team might be winning more games than expected due to these "lucky" factors. Conversely, a PDO well below 100 could indicate a team is facing bad luck, with shots that would typically not result in goals getting past their goaltender, or their own shots that would usually score being saved or hitting the post.
Over time, these percentages are expected to normalize, bringing a team's PDO closer to 100. This normalization process is what makes PDO useful for predicting future performance changes, as teams with very high or low PDOs are likely to see their performance move towards the average as their "luck" evens out. This aspect of PDO is why it's often associated with luck, as it captures the fluctuations in performance that can't be easily explained by skill or strategy alone.
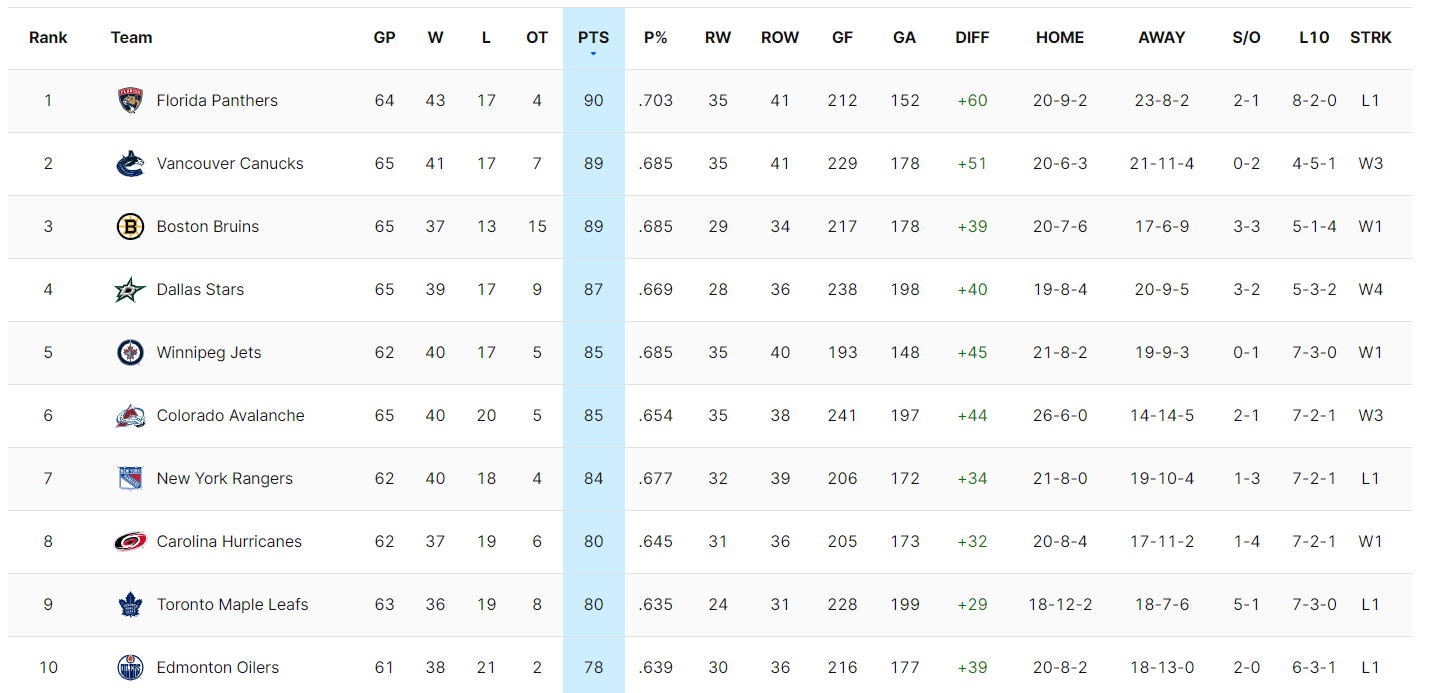
Luck notwithstanding, be sure to use PDO as but one dimension when evaluating a team or player. For example, the below is a recent snapshot of the top ten teams in the league from the NHL web site. Looking at the top-ranked teams by PDO, note that the top team below (Florida) by Points (PTS) is not in the top ten ranked teams by PDO. In fact, only five of the teams from the Hockey-Reference PDO ranked list are in the top ten below by PTS. Ergo, there may be other factors at play.
What are Example PDO Reports?
PDO reports provide valuable insights into team performance, luck factors, and potential future outcomes. Here are some example reports that can be built using PDO.
Trend Analysis Report
This report tracks the PDO values of teams over the course of a season to identify trends and patterns. It highlights periods of significant deviation from the mean (100) to spot phases of "luck" (both good and bad). This can help in understanding the sustainability of a team's performance. For example, the below chart shows a recent snapshot of Vancouver Canuck's PDO across the 2023-24 regular season. Note that the PDO can vary significantly across this period.
Goalie Impact Report
This report separates the Save Percentage component of PDO to evaluate the impact of goaltenders on a team's PDO. By comparing team performance with different goaltenders in net, one can assess how much of the team's "luck" is attributable to goaltending.
Special Teams Report
This report breaks down PDO by even-strength and special teams play (powerplay and penalty kill) to assess team performance in different situations. This can reveal areas of strength and weakness, such as a team that performs well at even strength but is boosted or dragged down by special teams performance.
Comparison Report between Teams
This report compares PDO values among different teams to assess relative performance and luck factors. This can highlight teams that may be overperforming or underperforming based on their underlying statistics, providing a different perspective from standard league standings. For example, the below chart shows a recent snapshot of PDO across NHL teams.
Regression Analysis Report
This report analyzes teams with extreme PDO values (significantly higher or lower than 100) and track their performance over subsequent games to study regression toward the mean. This can be useful for predicting future performance changes and identifying potential betting opportunities.
PDO Correlation Analysis
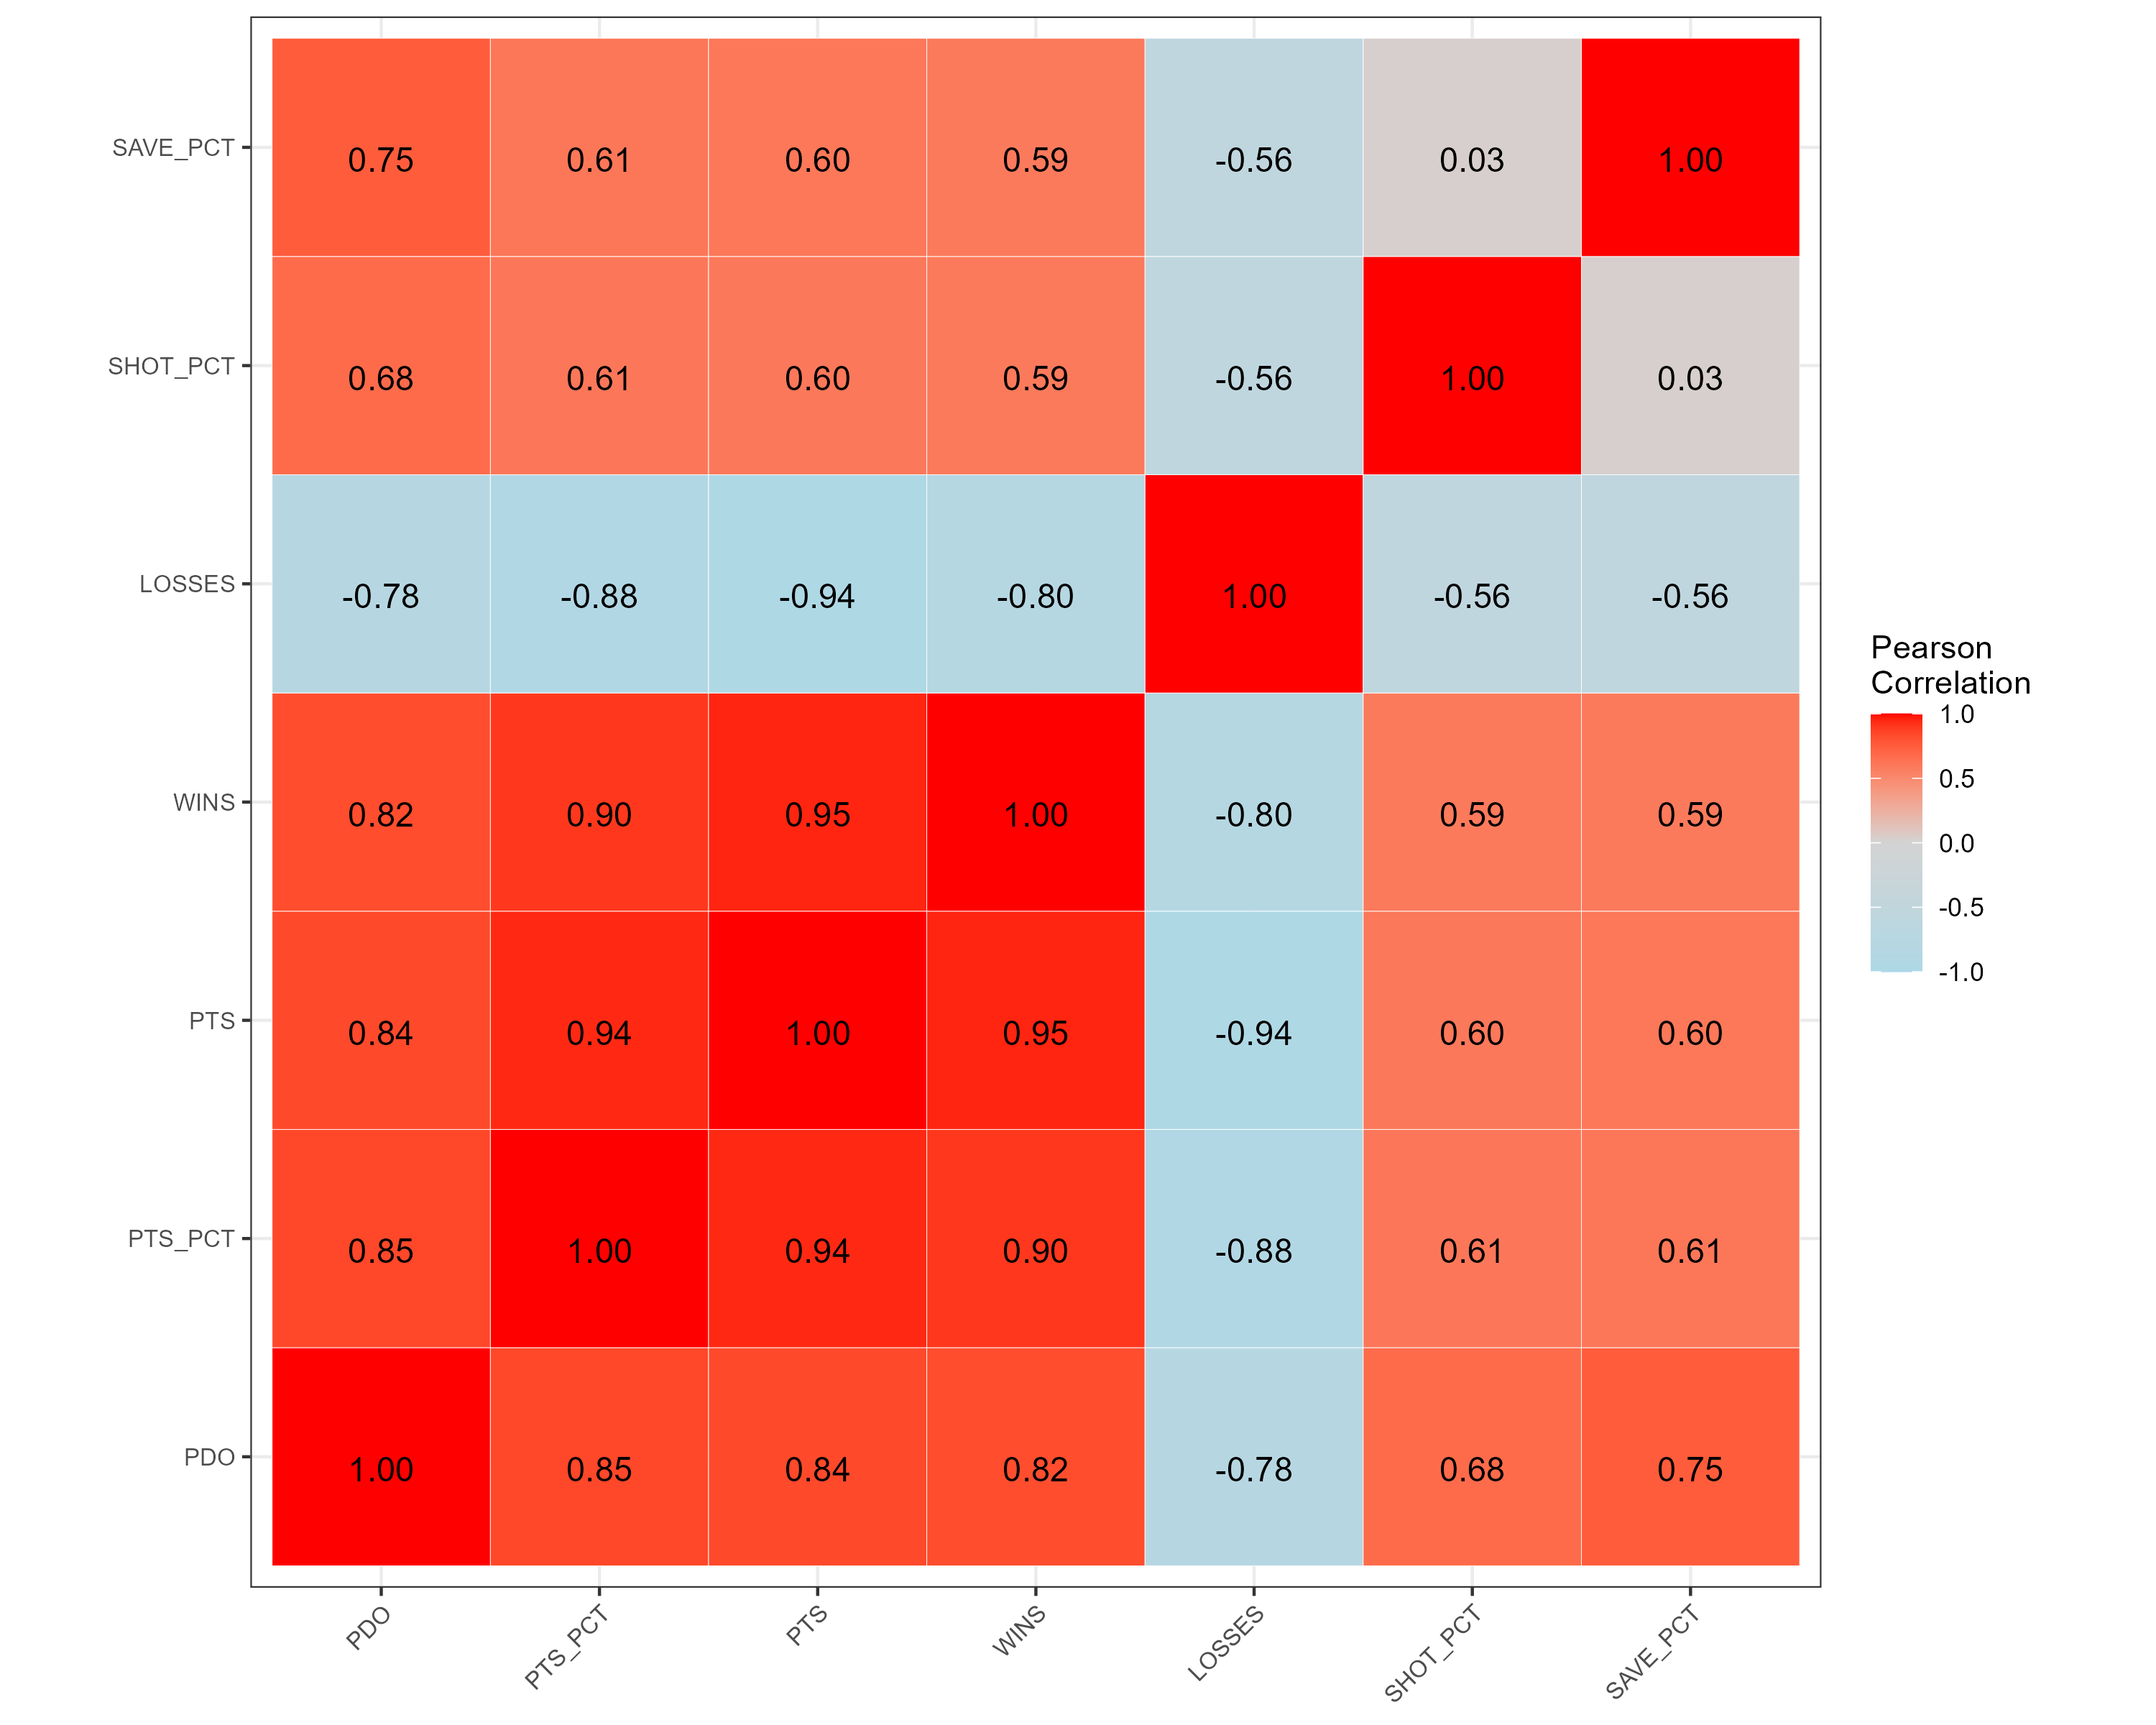
This report compares various raw or calculated stats with PDO to explore the correlation between those stats and PDO. This can provide indicators for what statistics have a positive, neutral or negative relationship with PDO. For example, below you can see a select set of hockey statistics within a correlation plot. Here you can begin to see higher or lower correlations between specific statistics and PDO. Points Percentage (PTS_PCT) has the highest positive correlation at 85%, and Losses (LOSSES) has the lowest negative correlation at -78%.
Player Impact Report
This report analyzes changes in PDO with certain players on the ice to gauge individual impact on team luck and performance. This can help identify key players who significantly influence game outcomes beyond traditional statistics like goals and assists.
These reports can be tailored to specific audiences, such as team management for strategic planning, bettors for identifying value bets, or fans for engaging content. By delving into the nuances of PDO and its components, these reports can uncover deeper stories behind the raw numbers of wins, losses, and traditional statistics.
Summary
In this edition, we introduced PDO, which is a hockey statistic that measures a team's or player's luck or performance by combining Shooting Percentage and Save Percentage. We'll quote Joshua Pollock here again: "[w]hen any player or team’s PDO is way above the mean of 100, they are getting extremely lucky; however, when they’re way below 100, they are generally getting unlucky."
While PDO is an interesting metric and does have positive correlations to Points Percentage, Wins, and Goals, we'd recommend tying it into a broader evaluation of a team. Including other metrics or analyses, such as offensive zone production, puck possession, goaltending, and so on, you'll find where a team is strong and weak – and why the PDO might be above or below average.
We also suggested several PDO reports that you can build if you want to go deeper on understanding of PDO, such as team comparisons, trend reports, correlation analysis, and so on.
Subscribe to our newsletter to get the latest and greatest content on all things hockey analytics!
Member discussion