Predict Like a Pro: More Winning Fantasy Hockey Strategies

In this Edition
- DFS Fantasy Hockey Series Recap
- Overview of the Winning DFS System
- Building Reports for a Winning DFS System
- What's Next?
DFS Fantasy Hockey Series Recap
This is Week five in our six-week newsletter series on Winning in DFS Fantasy Hockey using Analytics. To date, we've covered the following topics:
- Week 1: DFS Fantasy Hockey 101: Your Ultimate Kickoff Guide!
- Week 2: Winning DFS Strategies & Stats to Crush Fantasy Hockey
- Week 3: More Winning Strategies & Statistics for DFS Hockey
- Week 4: Building your First Winning DFS Report using Microsoft Excel
In this week's edition, we'll continue the journey from our last newsletter and discuss four additional strategies and discuss how you can create a more analytics-centric approach to your DFS game.
Overview of the Winning DFS System
This week, we'll continue to build out the DFS system we started in our last newsletter. Last week, we implemented a single strategy, High Volume Shot Player, in Microsoft Excel such that you could build your own spreadsheet using freely available hockey data (from Hockey-Reference). This week, we'll discuss four additional strategies such that you'll have an aligned mapping of DraftKings scoring to strategy to statistics for the following five strategies:
- High Shot Volume Players
- Line Stacking
- Winning Goalies
- Player Injuries
- Vegas Odds
Like we did last week, we'll then take two of the above strategies (Line Stacking and Winning Goalies) and implement them in Excel.
In this section, we'll walk through the summary of the winning DFS system, which includes the strategy, the goal of the strategy, the DraftKings points, and the analytics that will help in your decision making.
High Shot Volume Players
If you've been following this series, you're familiar with this strategy. As a review, though, below is the goal of the strategy, the DraftKings points that are awarded (that we're mapping into the strategy) and the analytics we will track to inform our decisions for this strategy.
The goal of this strategy is to select players who consistently get shots on goal. However, you'll also want to pick players who produce goals from their shots on goal. This represents the conversion of their shots on goal and will maximize your point gains.
The DraftKings points that map into this strategy are as follows:
- Goals: +8.5 points
- Power-Play Points: +1 point
- Shots on Goal: +1.5 points
- Hat Trick Bonus: +3 points
And the analytics that might inform DFS lineup decisions are as follows:
- Total Shot Conversion Report: Shot Attempts (TSA), Shots on Goal (SOG), Goals (G), Power Play Goals (PPG), Time on Ice (TOI)
- Per Game Shot Conversion Report: TSA per Game, SOG Per Game, G per Game, PPG per Game, TOI per Game, Hat Tricks per Game
Line Stacking
The goal of this strategy is to pick players from similar teams and lineups to maximize your point gains. In this strategy, you identify high-production players from the same team and lineup.
The DraftKings points that map into this strategy are as follows:
- Goals: +8.5 points
- Assists: +5 points
- Power-Play Points: +1 point
- Shots on Goal: +1.5 points
And the analytics that might inform DFS lineup decisions are as follows:
- Total Point Production: G, Assists (A), PPG, Power Play Assists (PPA), SOG, TOI
- Per Game Production: G per Game, A per Game, PPG per Game, PPA per Game, SOG per Game, TOI per Game
- Make sure the above are filterable by Team.
Winning Goalies
The goal of this strategy is to identify the best goalie among the available options. You should consider a team that wins more, the goalie's strengths, and also show shots on goal for the team their playing to gauge whether the goalie will take on more shots.
The DraftKings points that map into this strategy are as follows:
- Wins: +6 points
- Saves: +0.7 points per save
- Shutout Bonus: +4 points
- Goals Against: -3.5 points per goal allowed
And the analytics that inform decisions on players to maximize the above points are as follows:
- Goalie Metrics: Total Goals Against (GA), Total Saves (SAVES), Total Shots Against (SA), Goals Against Average (GAA), Save Percentage (SP), Shutouts (SO)
- Per Game Metrics: Shots Received per Game, Shots Allowed per Game
- Per Game Metrics: Goals Against per Game, Saves per Game
- Team Wins: Total Wins, Vegas Odds for Match
Player Injuries
The goal for this strategy is to discover which players are on the injured list for the upcoming game(s). Optionally, it's useful to understand a player's history of injuries; more historical injuries can lead to future, repeat injuries.
For this one, it's less about calculating the potential DFS points and more about how to avoid adding a player that may be removed from the lineup at the last moment or may be prone to injury – thus losing potential points.
The reports that inform decisions on the above are as follows:
- Injury Report: Player Name, Team, Injury, Injury Status
- Historical Injuries: Player Name, Injury, Total Injuries
Vegas Odds
This is the final strategy. The goal here is to leverage the experts. That is, there is an army of data scientists that work for the major sports books. It's rare that you're going to beat them, so why not use them as your starting point. That starting point integrates the smart math the sports books use to create their over/under, odds and money line. This also goes for the DFS ratings for each of the players.
Think of this one as a validation metric for your other strategies/analytics that you can use to confirm or re-think your lineup decisions.
The analytics that inform decisions on the above is as follows:
- DFS Rating: DFS Ratings across Major Platforms, Average DFS Rating
- Moneyline Odds: Over/Under for Game, Expected Margin of Victory
Bringing the Strategies Together into a System
Each of the five strategies outline above can in and of themselves offer you a winning DFS system; however, when taken together you can broaden your ability to optimize your gains and double-check your decisions with expert ratings and odds.
If you are going to take the learnings from this series and build your own reports, then the following approach might be a good first step:
- Build out reports using freely-available data for High Shot Volume Players, Line Stacking and Winning Goalies; and
- Reference useful sites or stats for the Player Injuries and Vegas Odds as a complement to your reports.
You can then test out the analytically-driven DFS system against the DraftKings scoring system and over time find reliable sources (and potentially procure data sources) for the injuries and odds.
If we take the above approach, for the data analyst who wants to build this for themself (or create it as a business to sell to others), integrating data from your data provider or multiple data sources will be a significant part of implementing this winning DFS system. For example, if we were to source the data for High Shot Volume Player, Winning Goalies and Line Stacking, here's where we might find the data.
- High Volume Shot Player - Hockey-Reference or NHL
- Winning Goalies - Hockey-Reference or NHL
- Line Stacking - Hockey-Reference or NHL
On the latter two strategies, getting the DFS ratings, Vegas odds and injury reports are a more manual exercise (unless you have a data provider for these specific statistics). Thus, below are websites that you can use as supplements to your reports. These sources give you a combination of DFS ratings, Vegas odds, and injury updates to help with your fantasy hockey strategies.
Let's turn to now discuss example reports for the aforementioned strategies.
Building Reports for a Winning DFS System
In our last newsletter, we sourced freely available data from Hockey-Reference and built a report for the High Shot Volume Player. This week, we'll:
- Describe how to build similar reports for Line Stacking and Winning Goalies; and
- Discuss how you might create reports based on a paid data subscription for Player Injuries and Vegas Odds.
For reference, here are the sample files we created for this week's examples.
- Player Statistics (for Line Stacking)
- All Goalies Dataset
- Winning Goalies Final Excel Report
- Winning Goalies R Code (Cleaning & Transforming Data)
- DFS Ratings Sample Dataset
Creating a Report for Line Stacking
Line stacking requires knowledge of:
- High point production players that are on the same team; and
- High point production players that play on the same line.
We can find the first of the above fairly easily. However, the second is more dynamic. That is, NHL teams might adjust their lines every few games, though some coaches are more consistent while others shuffle lines frequently based on different factors (e.g., injuries, player match-ups, special teams, and so on). It’s common for teams to have several different line combinations over the course of a season, with some even making tweaks multiple times in a single game. What this means is having a statistical report is more predictable than line-ups, so be sure to reference the sites listed in the last section for last-minute updates on injuries and proposed line-ups for that day's game(s).
One way to tackle the first part is to take the report we created in last week's newsletter, make sure that the TEAM and POS columns are visible and then build a slicer for TEAM. You can then filter on the team, sort the DFS scores (depending on the one you're interested in) and make your decisions based on the higher point-production players and who might be playing together in the lineup that day.
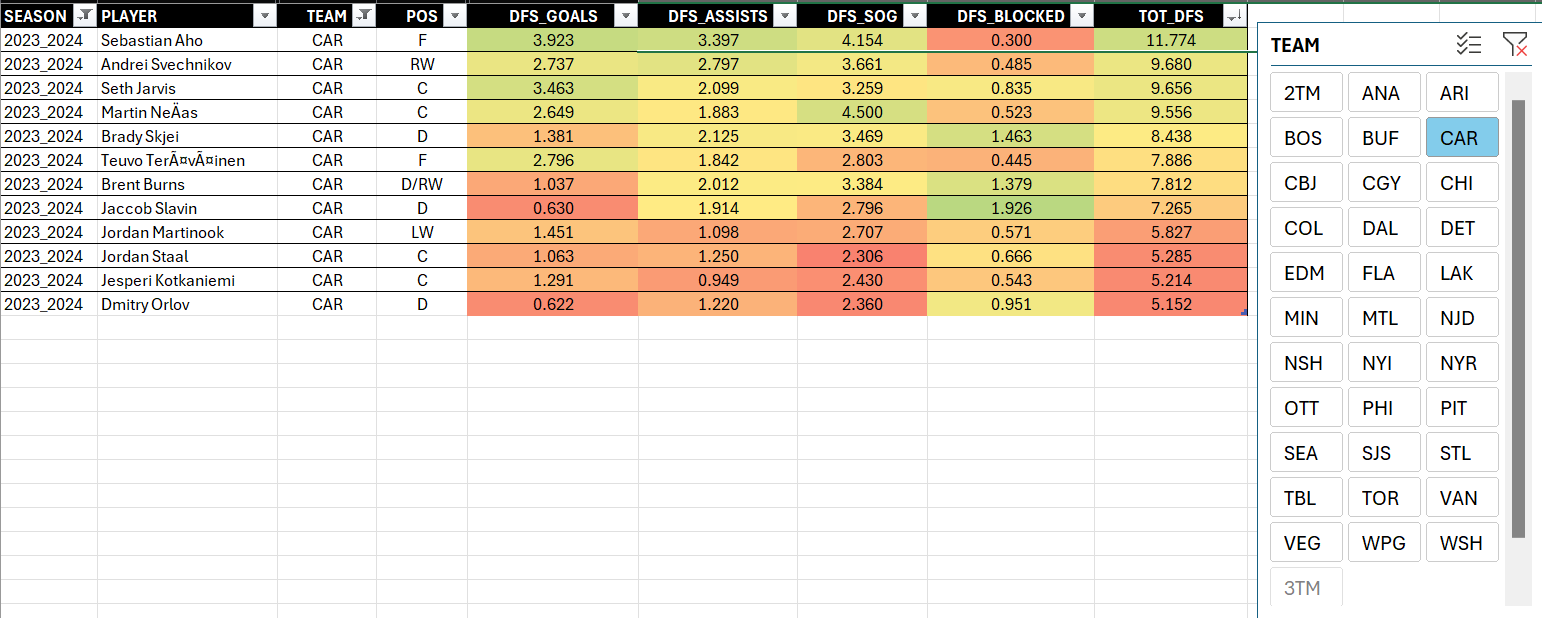
If you were to do this, then the data is freely available and you could build a multi-season report to not only show current season statistics, but also trending across seasons.
Creating a Report for Winning Goalies
Similar to how we build the player's dataset using Hockey-Reference, we used the goalie's stats on Hockey-Reference to build out a similar report. To do this:
- We downloaded three seasons worth of data.
- Cleaned and transformed the data (using R and RStudio). We re-purposed the code we built for the player stats, which you can find here.
- Created one CSV file.
- Created a heatmap in Excel that was our simple goalie report.
The result of this process was the below, where you can see we've built out specific goalie metrics based on the DraftKings scoring and used conditional formatting to create the heatmap. Super simple indeed.
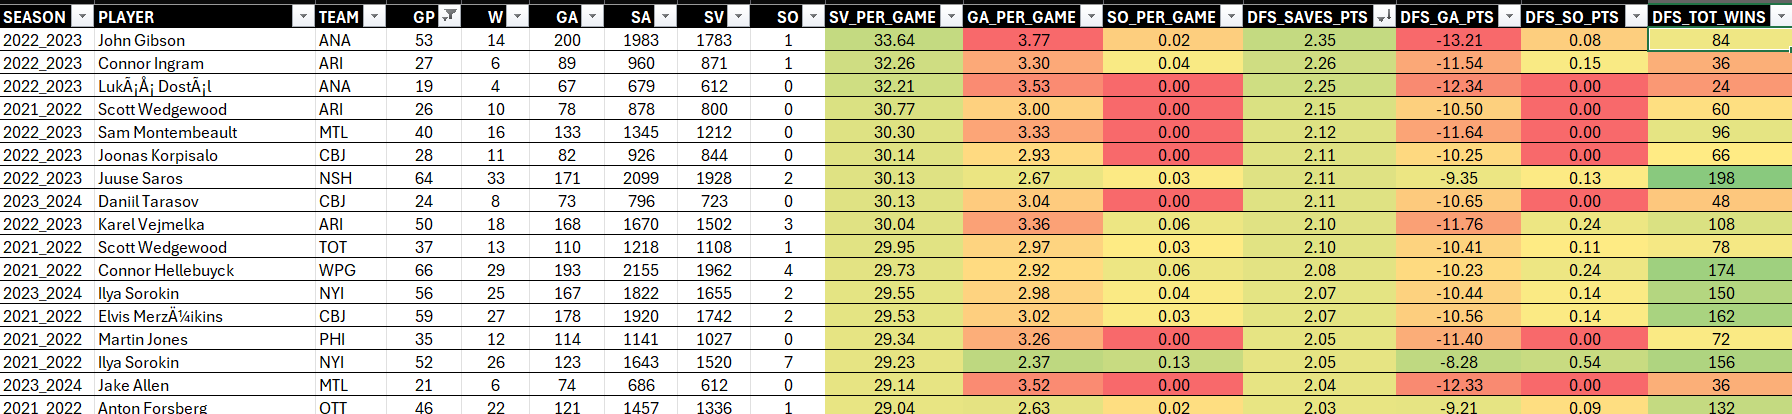
One difference, though, you should note between the player and goalie report. You'll find more "per game" statistics for the player stats, so the DFS points are more easily calculated and understood. However, for the goalies, you have a combination of per game stats and totals. Also, there is a penalty for goals against, so be sure to account for the positive and punitive points.
Creating a Report for Player Injuries
For player injuries, we pay for a hockey data provider which gives us the injuries for that day. The REST API for our data provider returns a CSV of the players who are on the injury list for that day. Here's an example row of data that is returned that we can then use. The useful information here is the player first and last name, their position, team, injury and play probability.

Using our data provider, we can also get a comprehensive report of all injuries for the players active within a given season. And while it's nice to see what players are out on game day, a way to help your decisions along is by having the histories of the injuries for all players. It's not a view that is readily available, but you can use it to evaluate the likelihood that a player might be injured in the future – their propensity, so to speak, for injury.
But, again, we get the above from a paid data provider, so if you're looking to create views from freely available data, then you may want to consider scraping from the sites we listed earlier in this newsletter.
Creating a Report for DFS Ratings
Another example report is the DFS Ratings report. We build this from our data provider and each day we get an updated view of each player's DFS rating across the major platforms. So, we create an average DFS score across the major platforms and apply some conditional formatting for the heatmap.
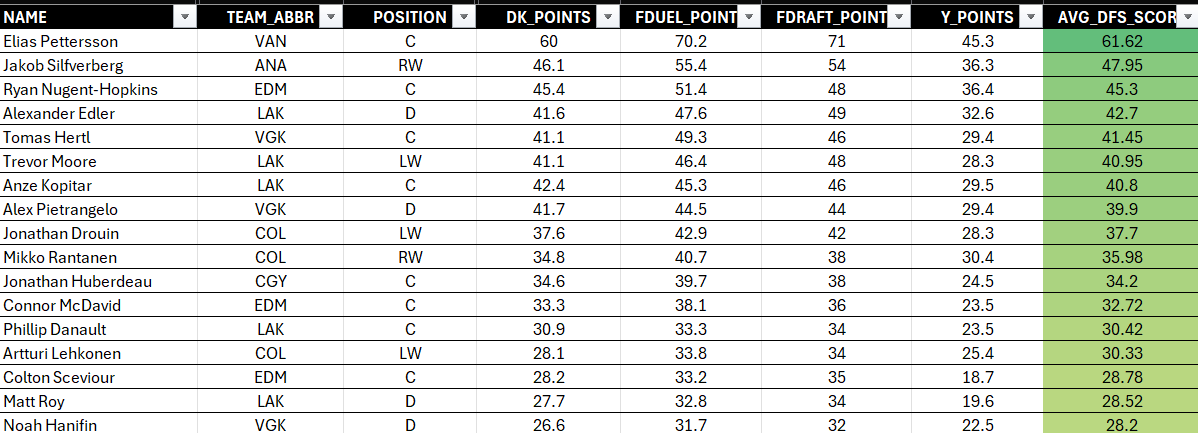
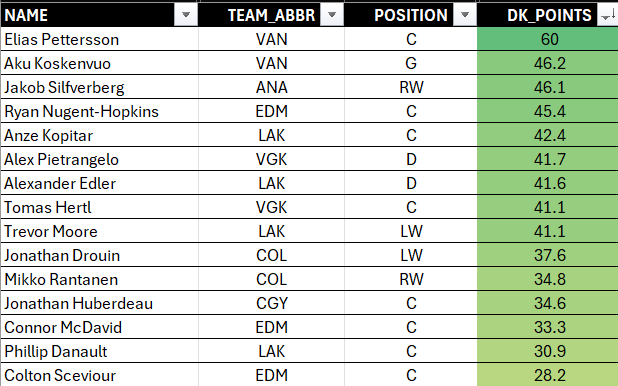
Because we've been focusing on DraftKings in this series, you could choose to filter on the DraftKings DFS rating, which would simplify the above report. The result would look like the below.
We'd recommend that the motivated build their own analytically-driven DFS system – even if you get information from websites, use paid DFS services, etc. This is because building your own system, even if it's in the simpler formats outlined above, will teach you how to leverage statistics and find the patterns, outliers and trends that lead to good decision making.
What's Next?
It's one thing creating different reports in Microsoft Excel, but it's yet another to integrate these reports into a single tool. And this is what our final task will be for this series. The goal for our final newsletter next week will be to create a single dashboard for at least three of the core strategies using data that is freely available.
We are going to build the dashboard in Power BI and make it available for you in case you're new to building out analytics in a tool other than Excel. The goal of getting the data into a consolidated form in Power BI is twofold:
- To have one analytical tool to help you make decisions (that is, your analytically-driven winning DFS system); and
- To take advantage of Power BI's many features that make building and publishing dashboards a much richer process.
So, we hope you'll join us for the final newsletter in the DFS series, which we'll release next week!
Summary
In this week's newsletter, we continued to align strategies to scoring to statistics. We broke down each of the five strategies and discussed where it would make sense to create a report and where it might make more sense to use existing websites and resources.
We then walked through some sample reports for Line Stacking, Winning Goalies, and DFS Ratings. The approach for those reports was one that was similar to how we built the High Shot Volume Player report in our last newsletter.
In our final newsletter of the series, which we'll publish next week, we'll bring the different reports and strategies together into a single Power BI dashboard. You'll then be able to explore and extend this dashboard for your own use.
Subscribe to our newsletter to get the latest and greatest content on all things hockey analytics!
Member discussion