Preparing for the NHL 2024 Draft

In this Edition
- Goals and Objectives
- What We'll Cover
- Exploring the Team Stats Dataset
Goals and Objectives
In the spirit of starting the second round before the first is complete, we're going to continue our playoff statistical coverage on our Playoff Stats page, but start looking forward to the upcoming Draft 24, which will be held on June 28-29 in Las Vegas. And rather than a single, weekly newsletter edition dedicated to a specific topic, we're going to spread the full analysis for Draft 24 across the next six weeks.
We're doing this because the draft provides us with an opportunity to walk the full analytical process together across a series of tutorials – a mini course if you will. There's a lot to consider when evaluating what teams need, and there is some great incoming talent that it'll be interesting to assess. So, for the next six weeks we're going to act the part of a Data Analyst (with deep expertise in hockey) with the end goal of creating an analysis that assesses team strengths and weaknesses and maps incoming prospects to those teams.
Within this aforementioned goal, we have two main objectives:
- Understand where each NHL team is strong and weak and identify potential gaps
- Assess the incoming 2024 draft prospects and map incoming talent to different NHL teams
We'll explore the above across the next six weeks, covering data exploration, data discovery, team assessment, incoming prospect evaluation, and a final analysis. Note that we will divide the final analysis into two deliverables: 1) the actual analysis and 2) a summary presentation.
At the end of the six weeks, you'll have:
- Two core datasets for exploratory and trend analyses:
- One with multiple seasons worth of team statistics
- One with basic stats for the top incoming prospects
- A dashboard with key metrics that show the strengths and weaknesses of each NHL team
- A dashboard that explores the top incoming prospects and explores their strengths, weaknesses and ranking
- A presentation that summarizes your findings and presents your recommendations to a fictional set of stakeholders
You'll then be able to use these dashboards as a starting point for your own team and draft evaluations and further customize based on the data we provide (or your own data) and methods we've covered here on Data Punk Hockey.
What We'll Cover
Over the next six weeks, we'll divide the newsletters into data exploration, data discovery, NHL team evaluations and prospect assessments. We'll close the six weeks with a summary analysis of the current state of NHL teams and the incoming draft prospects.
Within each, here's what we'll cover.
Data Exploration and Discovery
This will be split out across different tutorials, but will cover a quick exploration of the team stats data and prospect data. We'll clean the data and provide to you, so you can follow along assuming a structured and clean dataset. The data exploration will focus on describing what is in the datasets and the data discovery will look for potentially interesting patterns and trends in the data.
NHL Team Evaluations
For each NHL team, we'll select specific raw and calculated hockey statistics and conduct a summary for each team. We'll focus on what the numbers tell us and where appropriate bring in expert analyst opinions. Expect us to focus on stats that represent offensive, defensive and goaltending strength.
We'll run the same analysis for every team and provide a commentary to accompany the analysis. We'll use statistics from this past season for these evaluations and will also create trend analyses through multi-season datasets.
Prospect Assessments
We'll then pull together a dashboard that explores the incoming prospects. There are fewer statistics for these incoming prospects, and with the different leagues we'll guide you on how to weigh (and compare) their stats against the NHL stats – it's not an apples-to-apples comparison.
We'll run a similar analysis – as the data permits – for each of the incoming prospects and include expert analyst opinions on the top prospects. We'll also point you to some additional resources, so you're fully prepared for the NHL Draft – whether it be for fun, fantasy hockey or profit.
Final Analysis
As mentioned, the final step will be creating a summary analysis. However, the catch here is that you won't get away with just creating a Power BI report and sending it to a fictional stakeholder. That is, we'll also create a presentation as if we were going to present our findings to an audience.
Exploring the Team Stats Dataset
The first task we'll get started with this week is exploring the team stats dataset. This dataset will serve as the starting point for the team evaluations. The goal this week will be simple: download and explore the dataset.
To do this:
- Download the team stats dataset from here.
- This dataset is a CSV file that includes data from the 2018-2019 season to the 2023-2024 season. Note that it only contains regular season statistics.
- Open the dataset in Microsoft Excel (or your preferred spreadsheet tool).
- Review the columns and the nature of the data in each column.
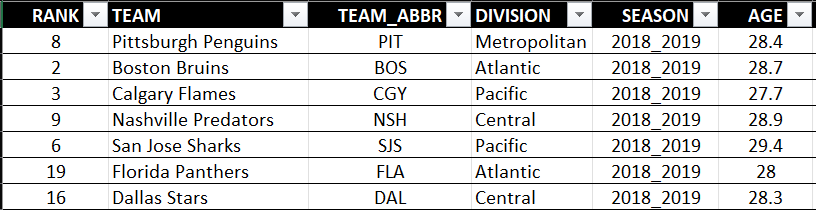
You'll see that the dataset includes multiple seasons worth of data with team metadata (e.g., team name, abbreviation, division, etc.) and raw summary stats (e.g., games played, wins, losses, etc.) and calculated summary statistics (e.g., points percent, powerplay percent, PDO, etc.).
For example, in the screenshot below, you can see various team metadata. Note that metadata like division (DIVISION) and season (SEASON) will enable you to create cross-divisional comparatives either for single seasons or across all seasons in the dataset. We'll dig into this more when we do data discovery, but when exploring the data think through ways that you can analyze it using the metadata.
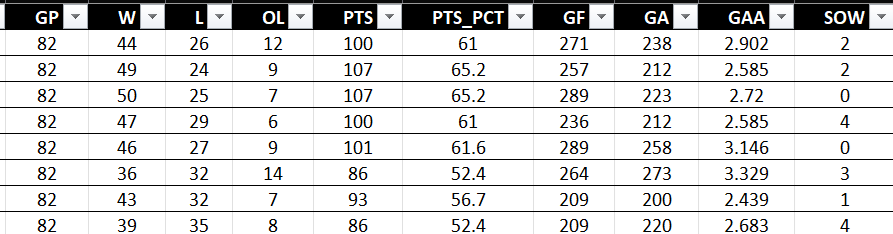
The dataset also contains thirty-one raw and calculated statistics. For example, the below screenshot illustrates a subset of the statistics included in the dataset. Here you can see raw statistics, such as games played (GP), wins (W) and losses (L), and calculated stats such as points percentage (PTS_PCT) and goals against average (GAA).
In our next newsletter edition, we'll start the process of data discovery on the above dataset. We'll then expand on the stats as necessary and conduct the team analyses.
Check out our quick-hit YouTube video below.
Summary
In this newsletter edition, we introduced you to a six-week series where we will act the part of a Data Analyst (who specializes in hockey) and walk the full lifecycle of preparing for the NHL 2024 draft. The series will cover data exploration, data discovery, data analysis (team assessments and incoming draft prospect evaluations), and final analysis.
Across this series, you will work through the full analysis lifecycle and also add a data storytelling component to it at the end – it's not just about how you analyze the data, but also the narrative you use to deliver it. This will give us a chance to break down each step in the hockey analysis process – using NHL's Draft 24 as the end-point for the analysis.
For this week, we shared the first dataset, multi-season team stats, and explored the team metadata and raw and calculated stats. In our next newsletter, we'll walk through the process of data discovery and begin the analysis process.
Subscribe to our newsletter to get the latest and greatest content on all things hockey analytics!
Member discussion