Sourcing the Early Eight with a Composite Metric

At a Glance
- Who's Going to Hoist the Cup
- Welcome to Crazytown
- The Team Balance Index
- How We Built It
- The League at a Glance
Who’s Going to Hoist the Cup
If you’re a Panthers fan, “We Are the Champions” has probably been on repeat all summer. For the rest of us, the offseason has been one long wait — now replaced by the hope that this year might be different. With preseason games underway, all 32 teams are chasing the same dream: the Cup.

It might feel premature to dive into Cup talk this early in the season, but if you’ve been watching the preseason games, you’ve already heard the chatter slip into color commentary.
Can we really predict who will raise the Cup this early? Not with certainty. But we can build a framework to gauge where teams stand now and track how those signals shift through the season.
Follow us on our Instagram site for updates, posts and announcements for special events.
Welcome to Crazytown
If you’re just starting your sports analytics journey, you’re probably getting comfortable with the basics: Wins, Losses, Goals, and other box score stats. Then there are calculated metrics like Corsi and Fenwick for puck possession or PDO for “luck” — blending shooting percentage and save percentage.
And sometimes, we create our own metrics. They’re fun, occasionally useful, and sometimes even reveal something cool. In a past newsletter, for example, we built a “Point-Producing Goons” metric from PIM, Fights, Hits, and Points — modeled for the likes of Brady Tkachuk, but also a nod to players like Gordie Howe and Keith Tkachuk.
But here’s the danger: once you start building composite metrics, you can go overboard. There's a few times we've found ourselves wandering around in Crazytown — where every stat gets combined into a new recipe for the Cup. But, alas, it's not.

So, in the spirit of insanity, let's take another run at it.
Team Balance Index (TBI)
If hockey history has shown us anything, it’s that the Cup isn’t won by flash alone. A hot offense peters out. Goalies run cold. What matters most is balance. Enter the Team Balance Index (TBI).
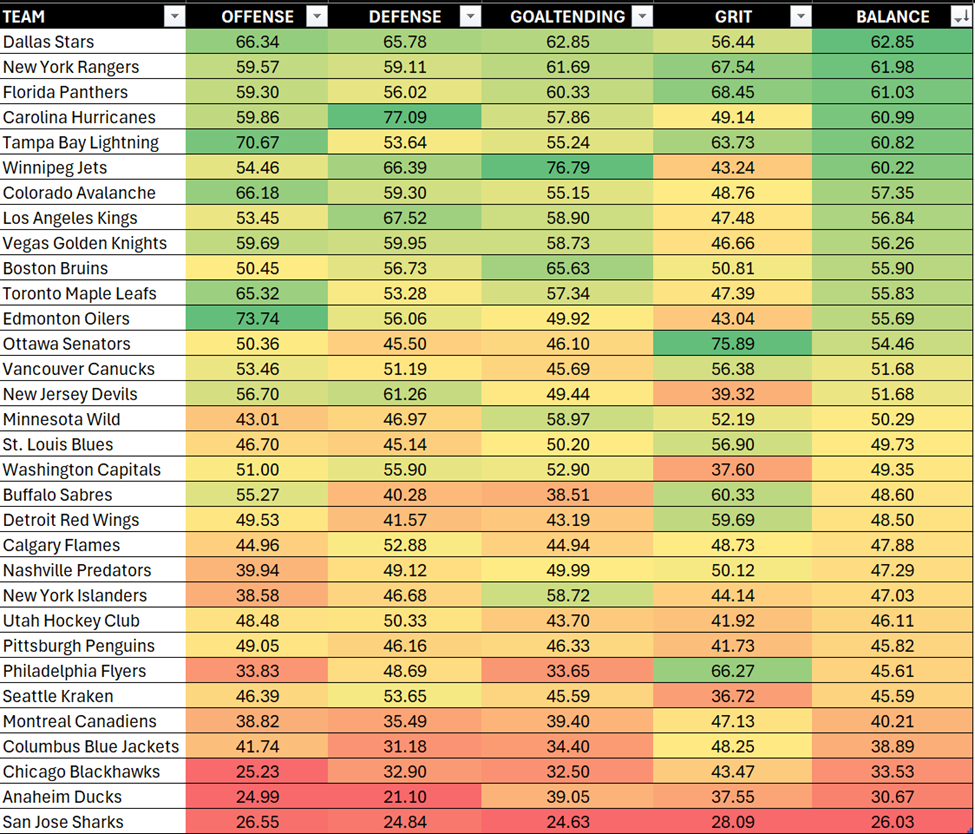
The TBI is our shorthand for measuring four core areas: Offense, Defense, Goaltending, and Grit. The teams that win in June don’t just dominate in one category — they’re solid across all four. Just ask Oilers fans how much grit mattered last spring.

For this season-opening newsletter series, we’re using the TBI to identify the Early Eight — the teams most likely to reach the divisional finals. We’ll update as the season unfolds and put the metric to the test, but this early snapshot gives us a way to benchmark contenders. You'll also learn how you can build your own composite metric.
How We Built It
Each TBI component is a composite metric built from standard hockey stats, normalized, and averaged. The higher a team scores across the four dimensions, the higher its TBI. Here, you can see a sample of Cup contenders over the past three years and their average TBI – along with the trend.
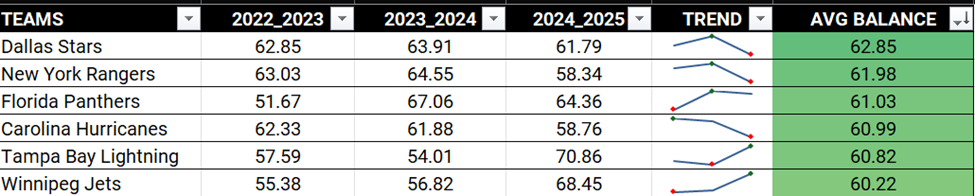
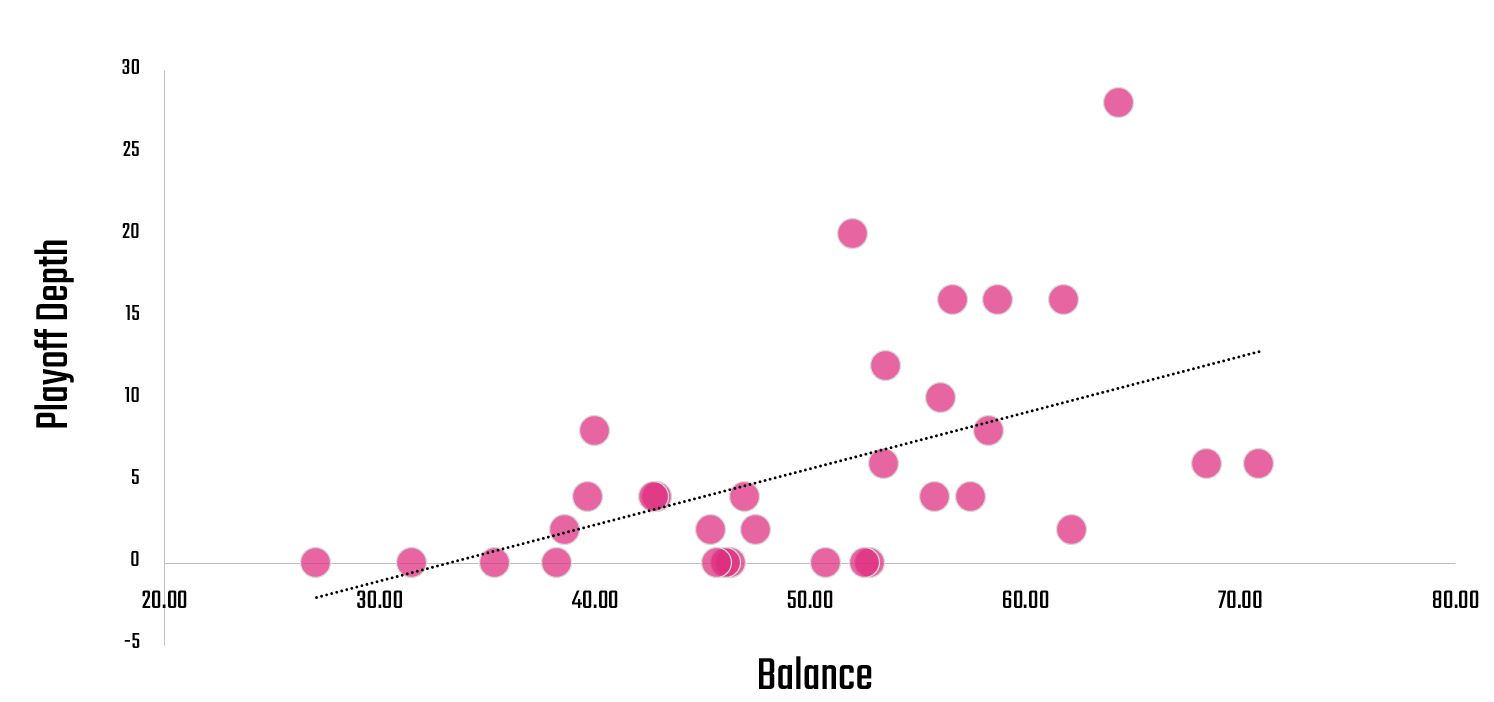
Looking back over the last three seasons, higher TBI scores have directionally lined up with deeper playoff runs. The correlation isn’t ironclad (so we wouldn't recommend this as a predictor) but the trend is evident: balance can travel.
The League at a Glance
Our first step was to apply the TBI across three years of team data and build a heatmap. It shows, at a glance, where each team is strong, weak, or stuck in the middle. While this is a rolled-up three-year average, the pattern is unmistakable: the teams at the top have been playing deep into May and June.
So, what does this mean?
Balance isn’t glamorous. It won’t dominate highlight reels or light up social media. But it’s often the difference between watching the Final and playing in it.
These early signals will frame our focus in this series. And by the end of October, we’ll have built a dashboard with data (and make it available for you to use at home) that will reveal the two teams from each division we believe are best positioned to contend in this year's Stanley Cup. This of course will shift throughout the season, but thus begins the fun.
The Week Ahead
Look out for more coverage on TBI and the Early Eight this week through the following topics:
- Composite Metrics — Use and Abuse
A quick look at where they add value (summaries, aggregates, directional signals) and where they don’t. - Consistency Matters
Which teams have been consistently balanced, and which haven’t? We’ll chart trends for both the top and bottom quartiles. - Does Balance Win Cups?
Comparing BI scores to playoff performance — are there hidden “ingredients” to Cup runs? We'll build a dashboard to use as a tracking tool.
Sign up to get free access to more weekly content and courseware on all things Hockey Analytics.
Member discussion