Which Four Nations Team will Win the Gold Medal at Milano?

A Data-Driven Look at the top Four Men’s Olympic Hockey Nations and their Drive for Gold
At a Glance
Introduction
Every Olympic hockey tournament pretends to be wide open. In reality, there’s usually a smaller inner circle; these are the teams with the depth, experience, and muscle memory to survive a short, brutal tournament where teams have to come together quickly and deliver on even a shorter timeline.
A key differentiator in the Men's Olympic hockey tournament is the fact that NHL players are allowed to play on national teams.
As you can see from the visualization below, most players come from a small list of countries, so invariably these teams have the advantage when it comes to the Olympics.
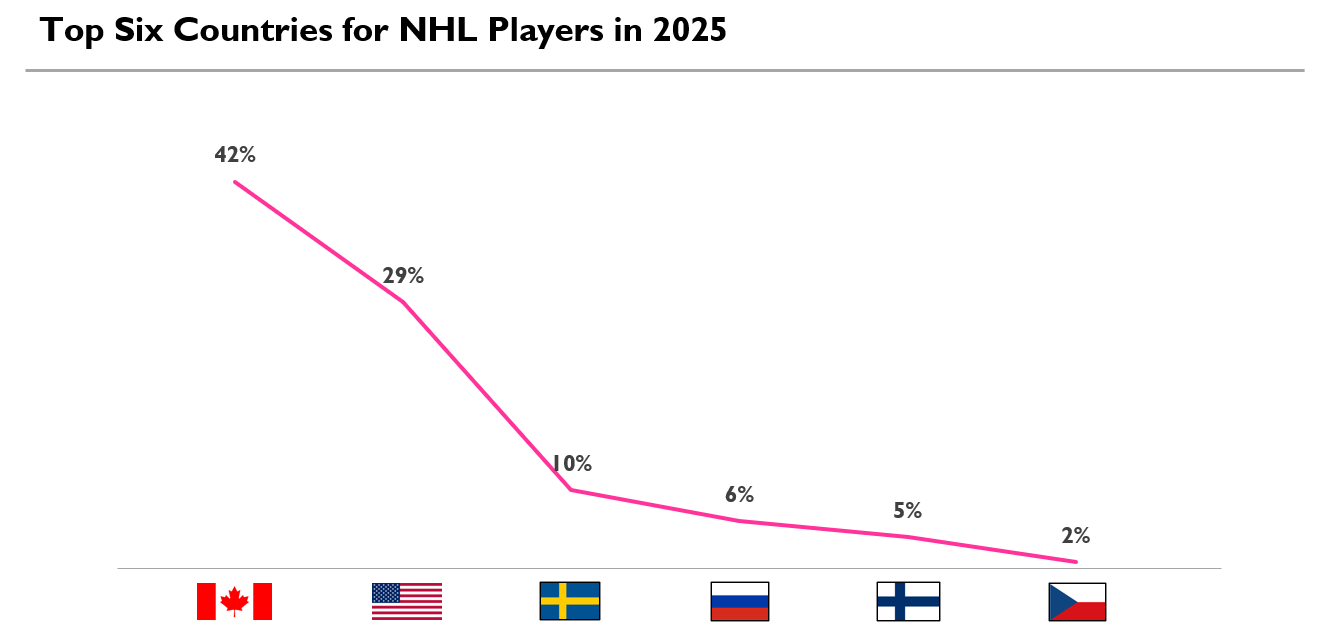
And as we head into the Men’s Olympic hockey tournament, the aforementioned inner circle is clear: Canada, United States, Sweden, and Finland.
Say what you will about these countries, but each of them:
- Supply the largest share of NHL players in the tournament;
- Were featured in last year’s Four Nations Face-Off, effectively serving as a dry run for Olympic competition; and
- Represent four distinct hockey identities that show up in the data.
So, why are we telling you this?
In this week's newsletter, we'll analyze player and goalie stats (and aggregate at the team level) to see which one of these teams is better positioned to win the gold medal.
Okay, let's get at it!
What Sets these Teams Apart
Like any major tournament, a significant part of success is the ability to come together very quickly as a team. This means setting ego aside, folding into a role, quickly forming as a team, and helping drive the team to success at the international level. Unlike the Stanley Cup, Olympic hockey isn't about building over seven games; the path to success or failure is speedy. Lineups have to rapidly form; goaltending has to settle; and the team has to quickly implement a system that supports shots to goals before the margins slip away.
We Focused on Five Areas
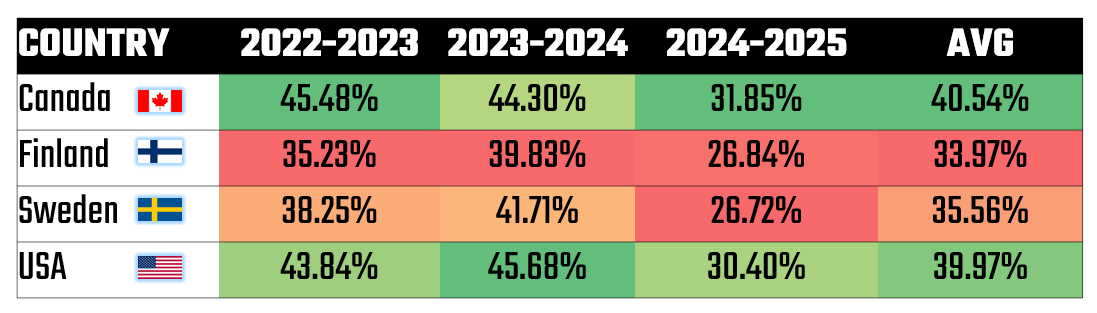
Teams with NHL-heavy rosters have strong players – many of whom may be superstars on their own teams. These four nations dominate NHL participation not just in raw counts, but in a variety of areas. Our analysis covered five areas (using raw and calculated statistics), and by ranking the teams first and second, you can begin to see what sets them apart.
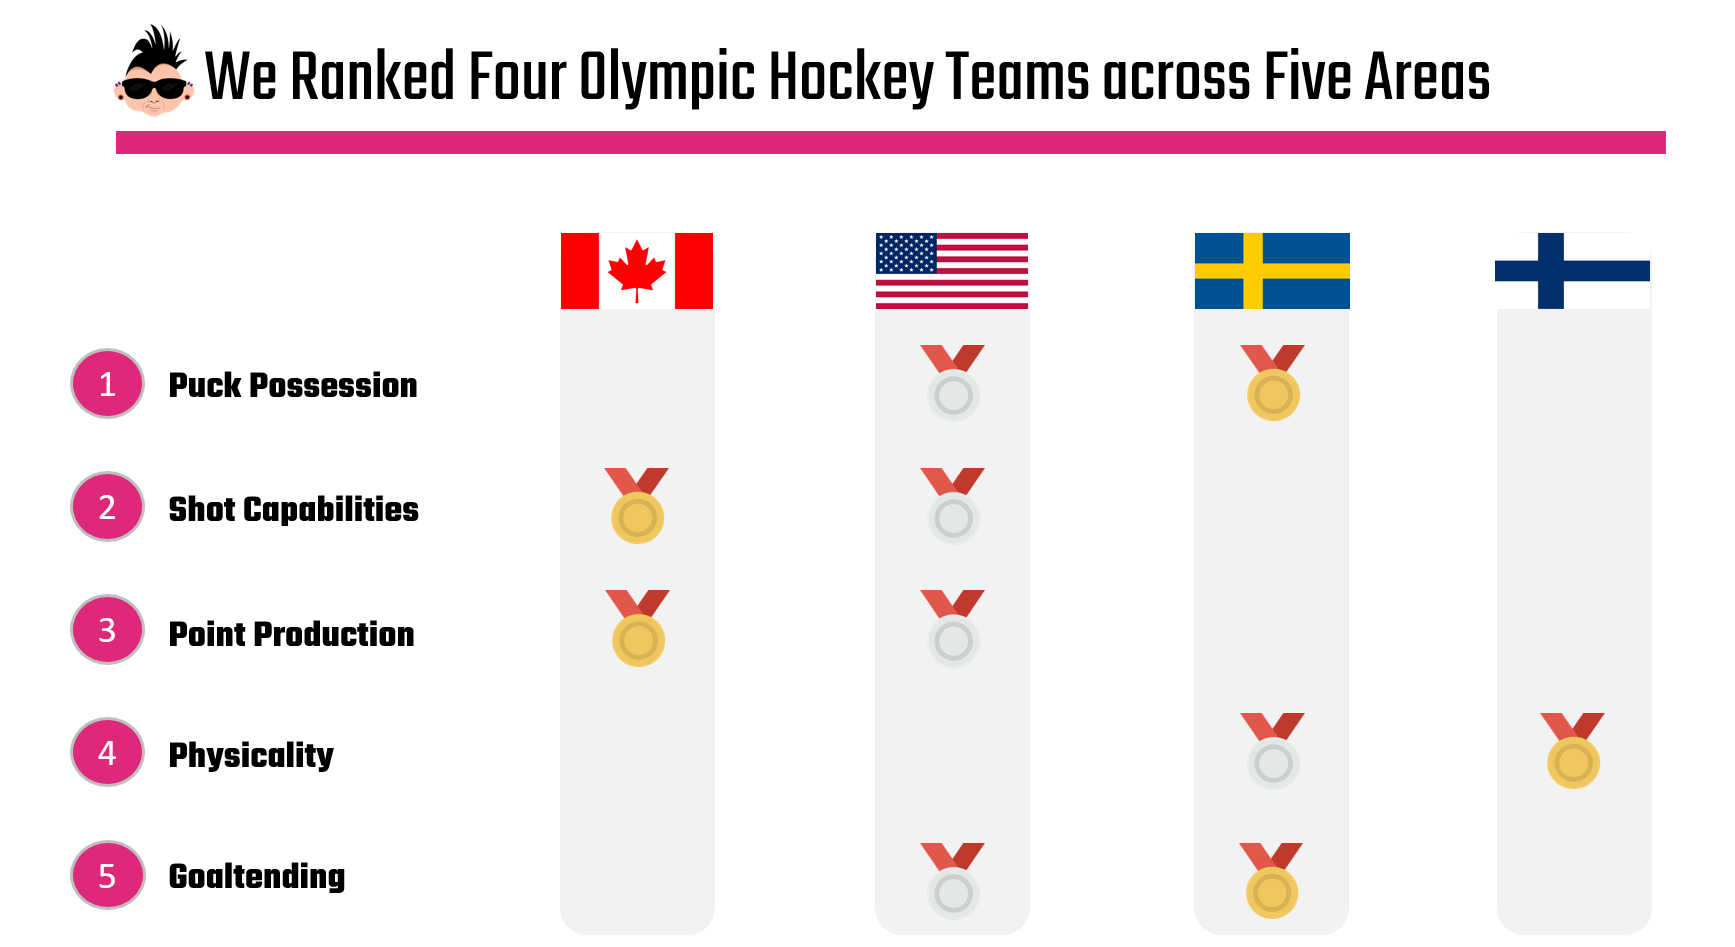
For example, this probably comes as no surprise, but Canada is strong on shots and converts those shots into point production. The USA is strong across the board, but didn't necessarily finish first in any one area. Sweden, similar to last year, came in strong for goaltending. They also were strong on puck possession. And Finland (this caught us off guard) came in strong in physicality – perhaps they'll be the agitator?
Besides Finland, the above tracks on what we found in our Four Nations Face-Off analysis. If past is prologue, this year will be another tight battle between Canada and the USA.
In last year's Four Nations Face-Off tournament, USA won the round robin with the standings as follows: USA, Canada, Sweden and Finland. However, in the final playoff Team Canada beat Team USA in overtime. Our analysis had pointed to a toss up between the USA and Canada, and this proved to be true.
Be sure to check out our Sports, AI and Storytelling Living Course. Each month, we pick a sport and do a deep-dive analysis along with the creation of a storyline.
What Does the Data Say
For the 2026 Olympic Hockey analysis, we did the following:
- Took a snapshot of player and goalie data from our daily NHL pipeline.
- Filtered for the Four Nations players
- Analyzed across Puck Possession, Shots, Point Production, Goaltending and Physicality
We then ranked the teams based on what we found.
You can download a snapshot of the raw player data from here, so you can replicate or build on the following reports.
Puck Possession
Puck possession is key in hockey because those teams that typically can control the puck more tend to convert. Our data provider unfortunately doesn't include CORSI, so to measure puck possession, we created a custom metric combining different statistics, and interestingly Sweden came out on top.
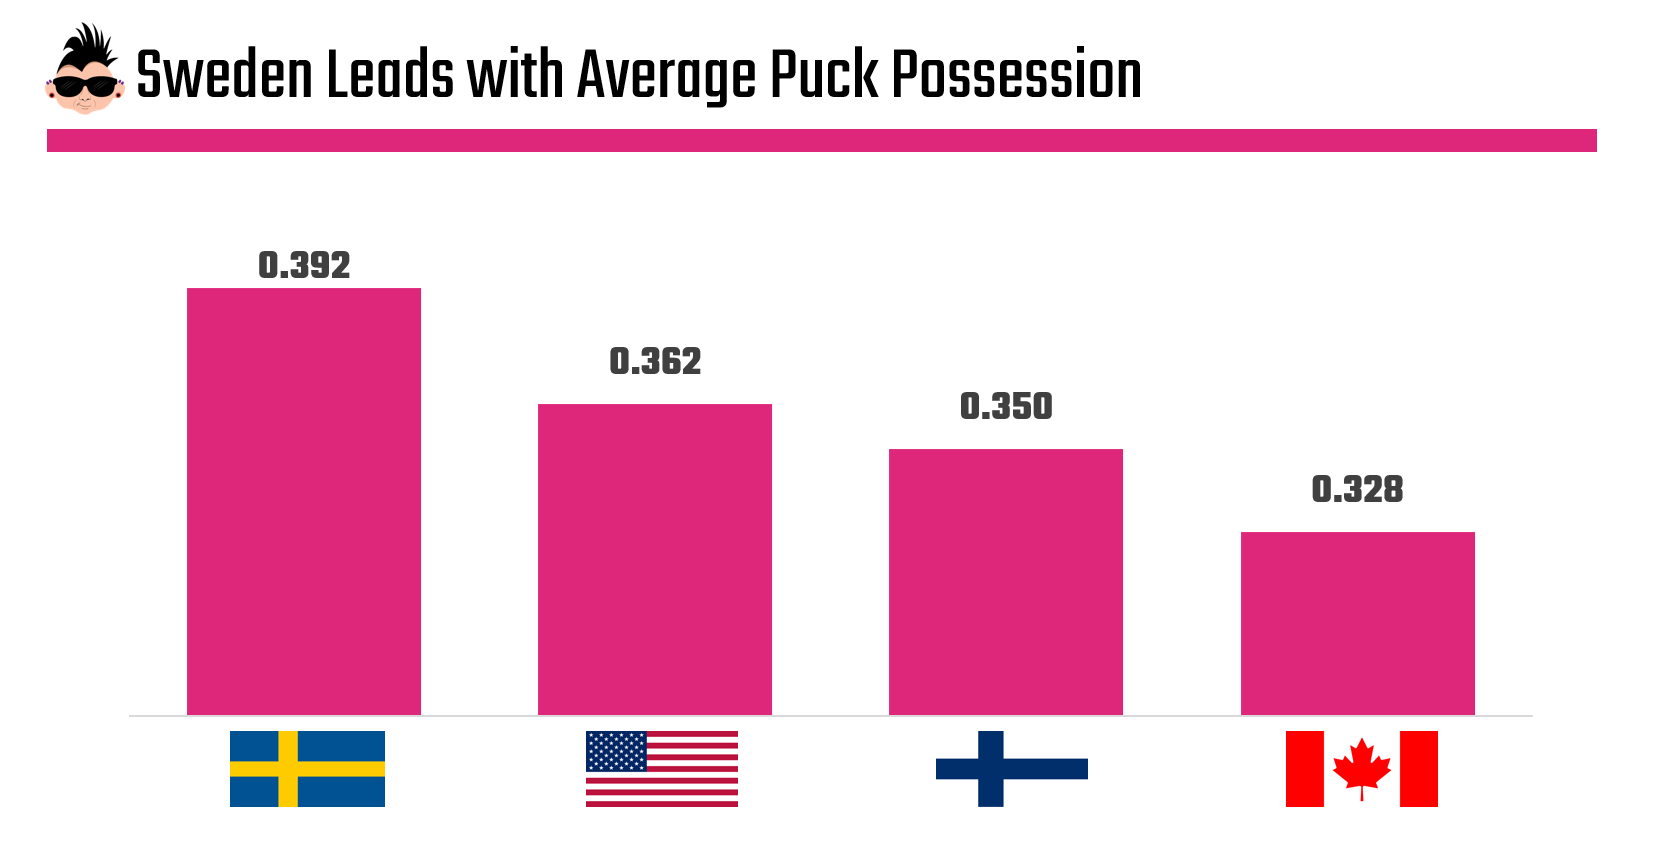
While Sweden, in our analysis, landed higher on the puck possession scale, they fell behind when we started looking at more traditional production metrics such as Shots on Goal and Shot Percentage.
Shot Strength
Shot strength is key, so we measured two statistics when it came to shots. The first was Shots on Goal (SOG), and the second was Shot Percentage. SOG tells us how many shots a team gets on goal, and Shot Percentage tells us the percentage of shots that they convert into goals.
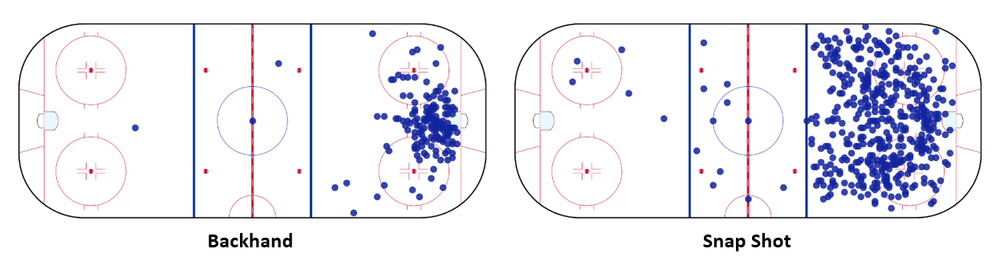
Be careful treating each SOG equally. For example, shot types are an important differentiator; that is, back-handers produce different results than snap shots and wrist shots. Further, each shot type is used in different frequencies. The image below shows the frequency of backhand shots versus snap shots (and distance from net).
Back to the analysis.
You can see the results below. Each nation has their average Shot Percentage (top bar) and their SOG (bottom bar) by player.
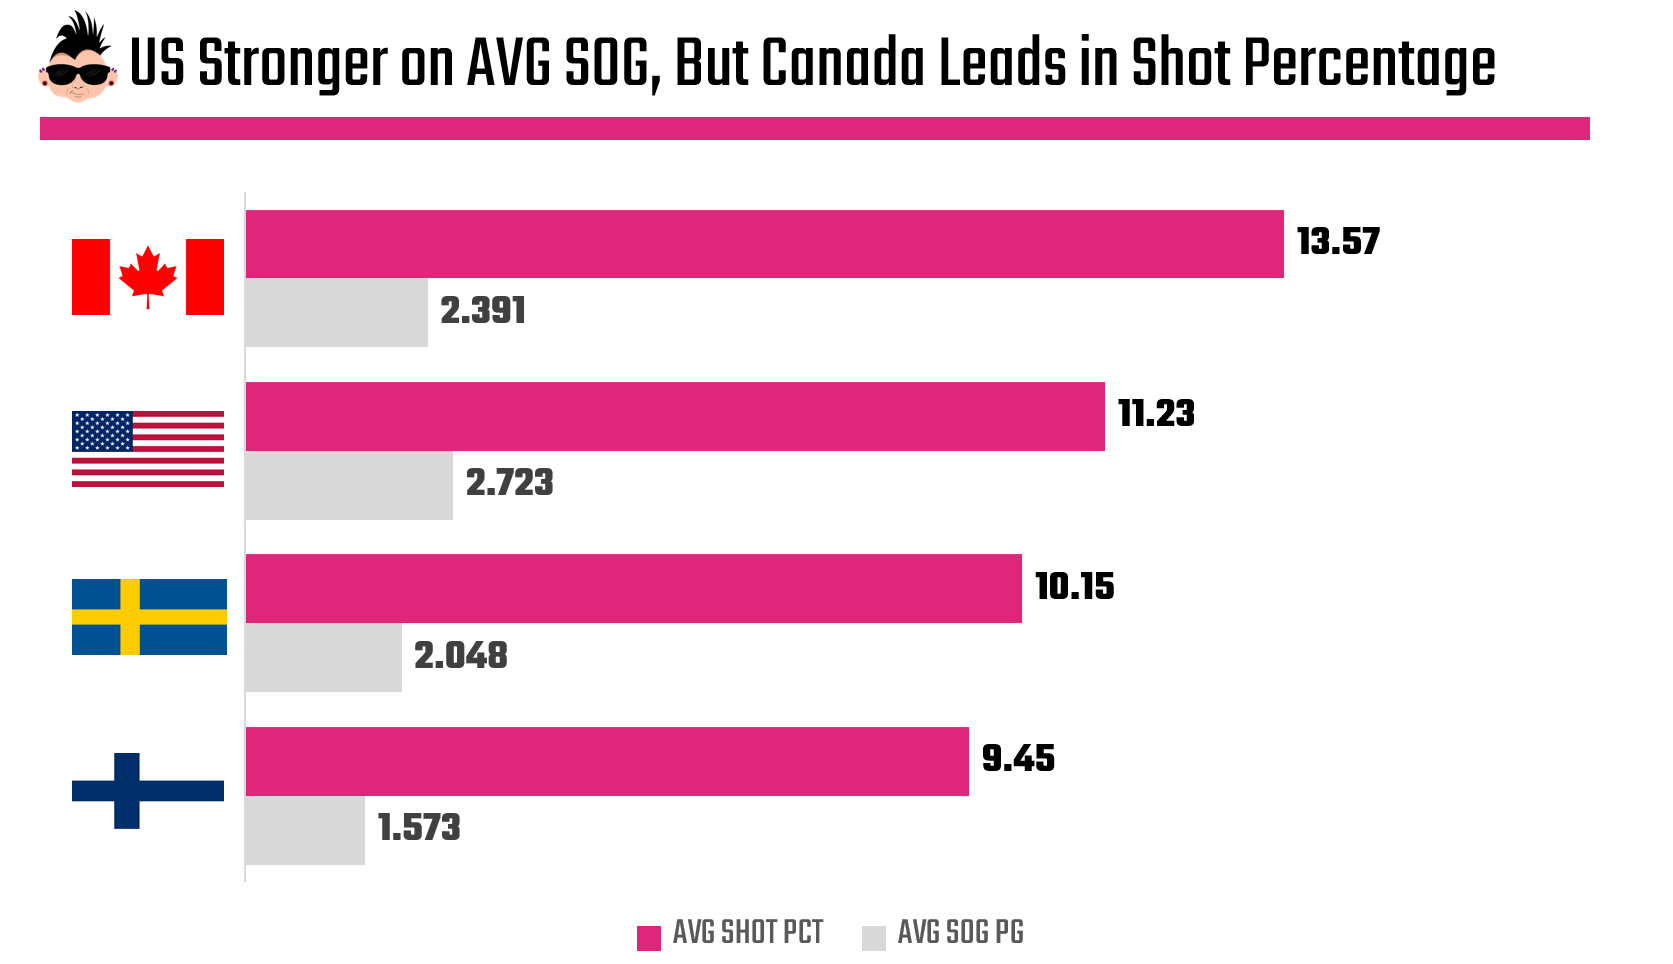
However, the results here are interesting because while the USA has a higher average SOG per player (2.723), Canada leads in average Shot Percentage (13.57).
Our takeaway, then, is that Canada can convert on a tighter number of shots. And the degree of conversion using Shot Percentage is significant: 2.34%.
Check out our Living Course module on Discovering Who Will Win the Gold Medal for Men's Hockey.
Point Production
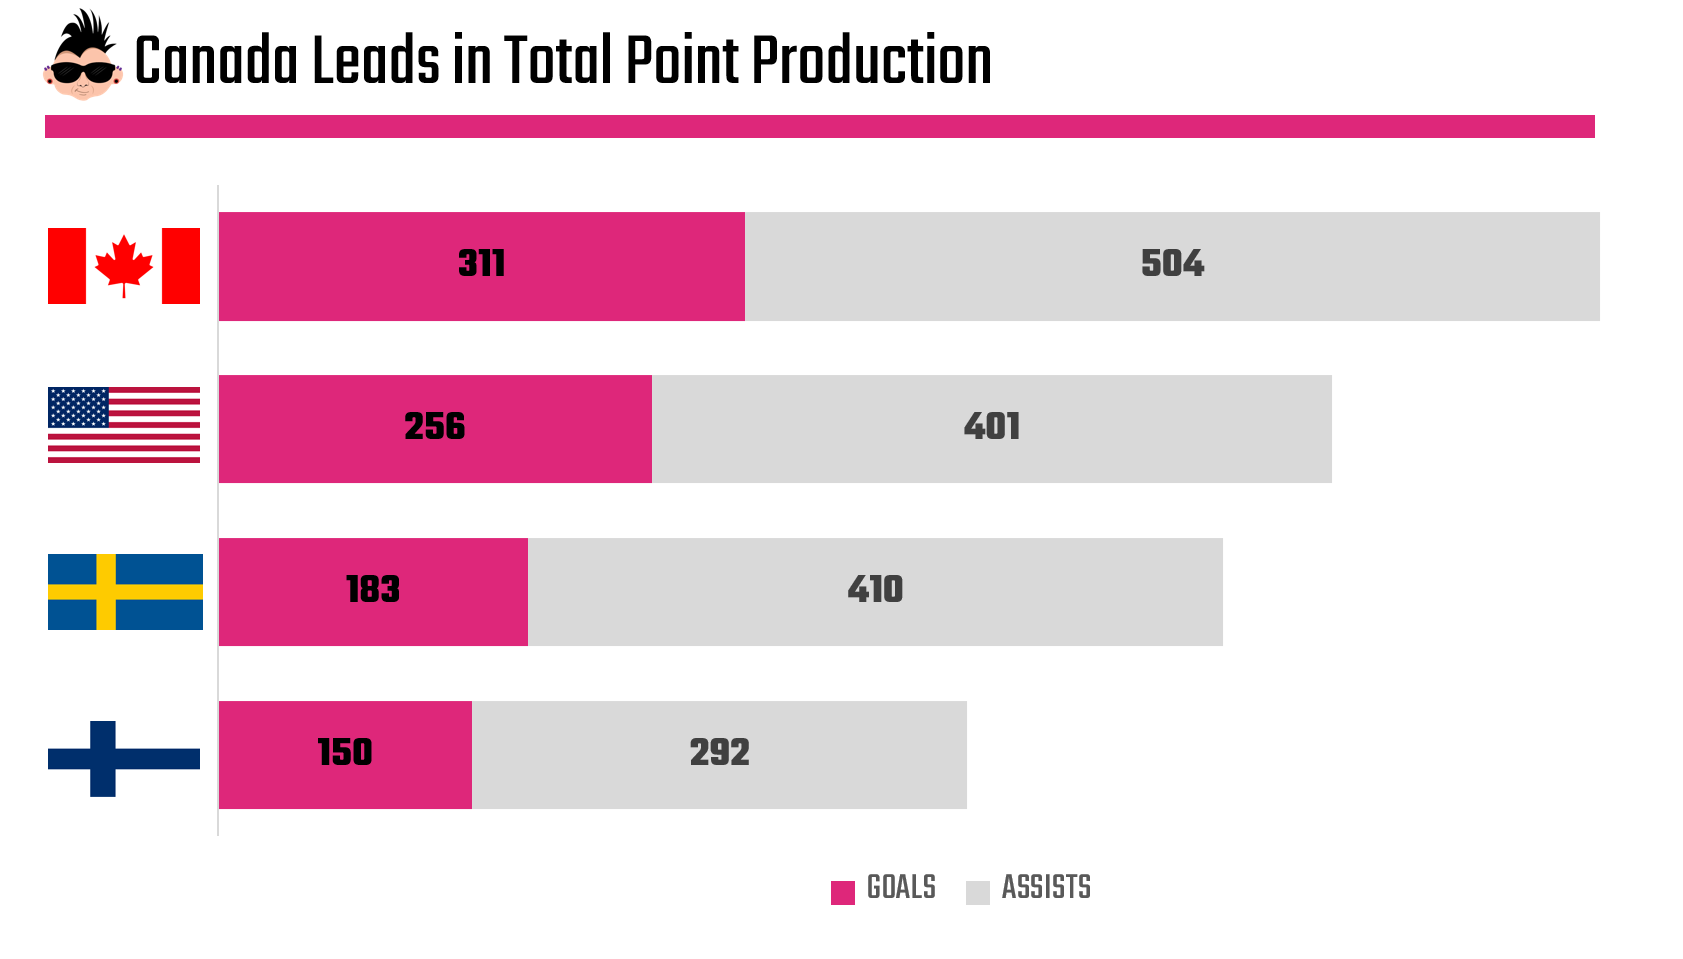
We looked at point production from two aspects: Total Points (for all players on the team) and Points per Game (by player). On Total Points, Canada was way far out in front of the other teams – by a significant margin again. They have players who can put the biscuit in the basket!
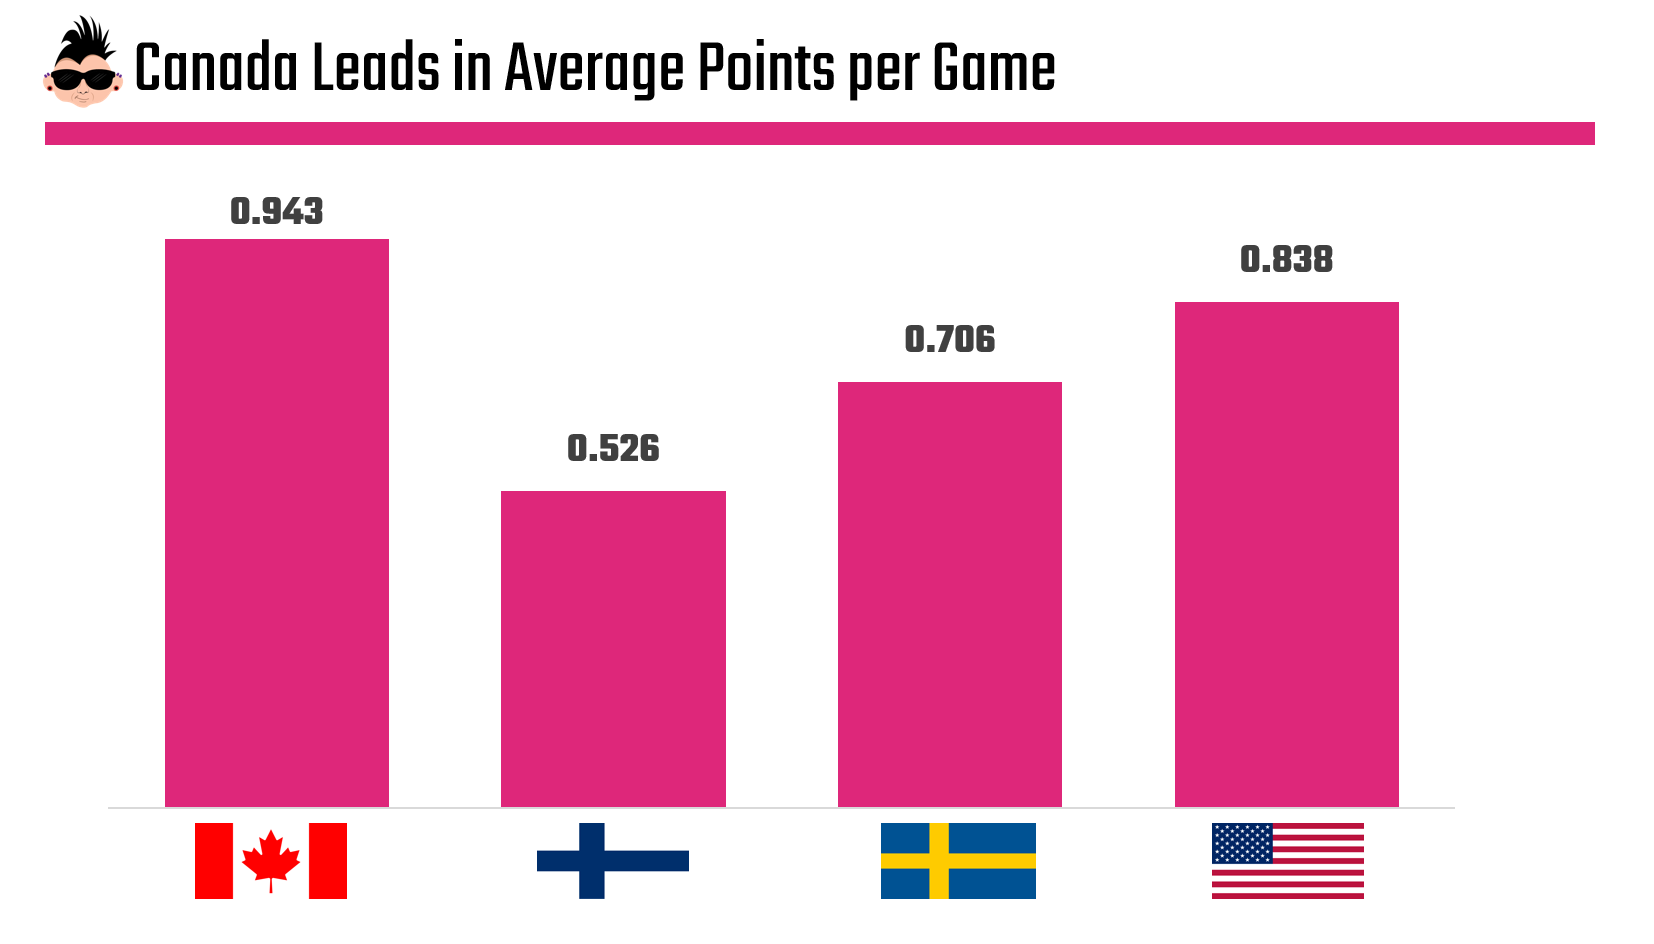
When viewed through the Points per Game lens, Canada unsurprisingly came out ahead again by a significant margin.
Now, in last year's Four Nations Face-Off tournament, Team USA looked like they might take the entire tournament. However, in the final between the USA and Canada, they lost in overtime. And as we mentioned earlier, our analysis result was a coin toss between the USA and Canada. For example, below is an Offense metric we created to compare the teams across several offensive statistics. Clearly, Canada and the US were very close: .57%.
However, if you evaluate the results of the production stats this year, Canada appears to be much stronger. That is:
- They are showing they can convert – with a higher Shot Percentage;
- They have obtained an overall higher total point count; and
- Their Points per Game is impressively out in front.
Canada’s weakness, if it exists, isn’t scoring. It’s that offense sometimes masks defensive inefficiencies. When they lose, it’s usually because:
- Goaltending variance (they have a lower goaltending ranking); and
- They tend to be less physical, so are prone to being dominated on the ice.
That said, in short tournaments like the Olympics, goals are currency—and Canada is currently printing them.
For us, this all points to Canada having the advantage.
Goaltending
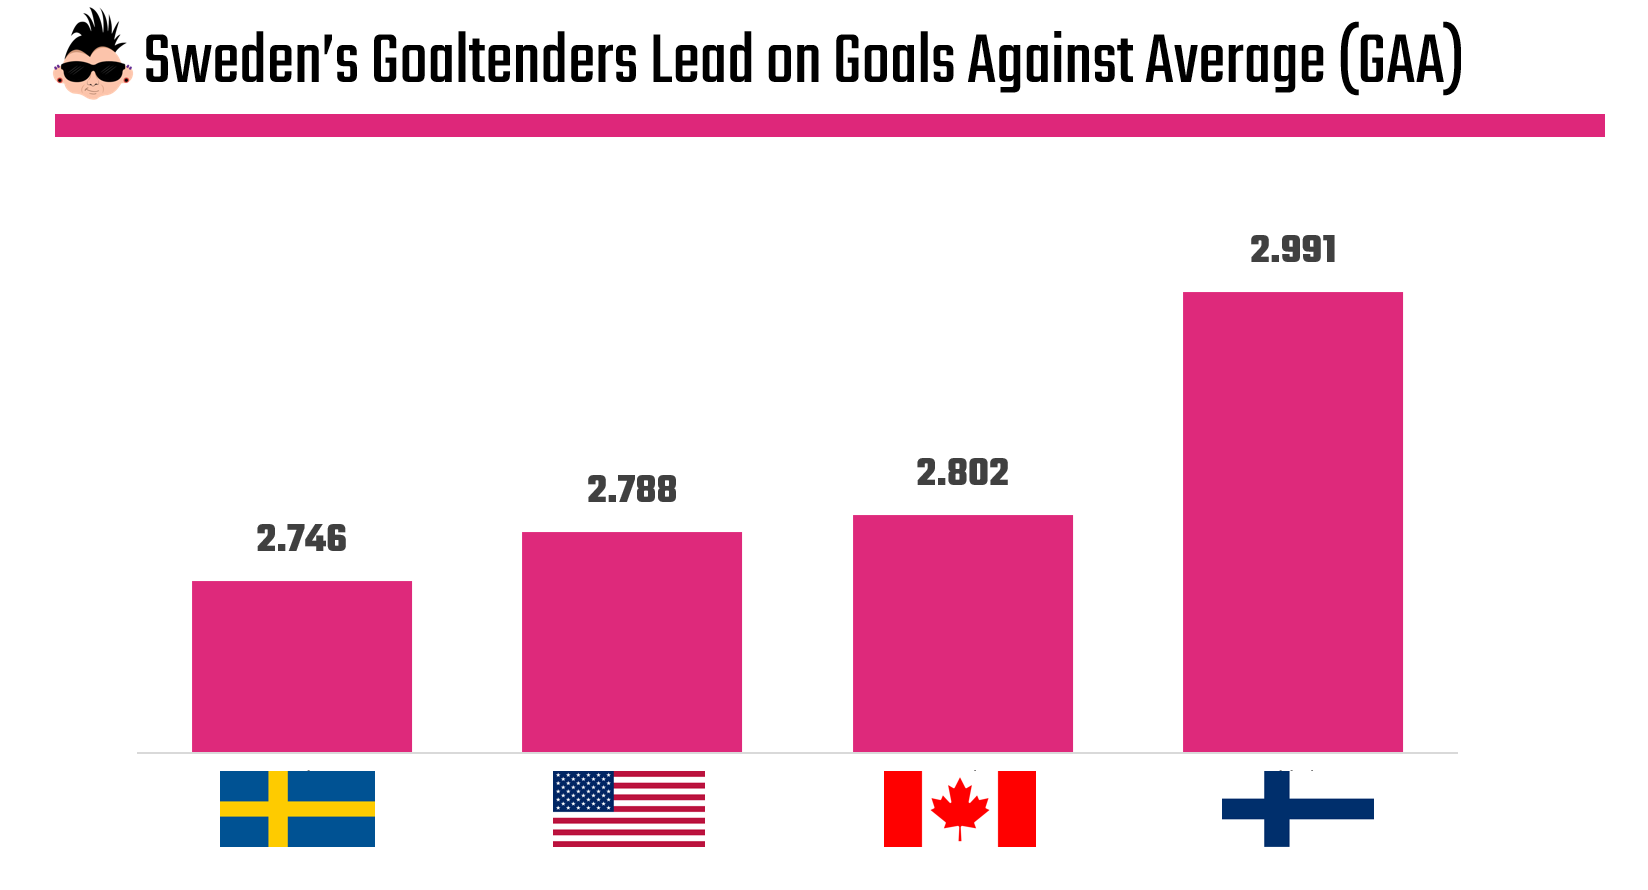
For the second year in a row, Sweden takes the top spot for Goaltending. They lead in both Goals Against Average (GAA) and Save Percentage, both of which are shown below.
On GAA, Sweden leads, with the USA and Canada in second and third. Finland, however, are fourth and by what we would consider a significant margin.
Save Percentages run a bit tighter, but here again Sweden is out in front.
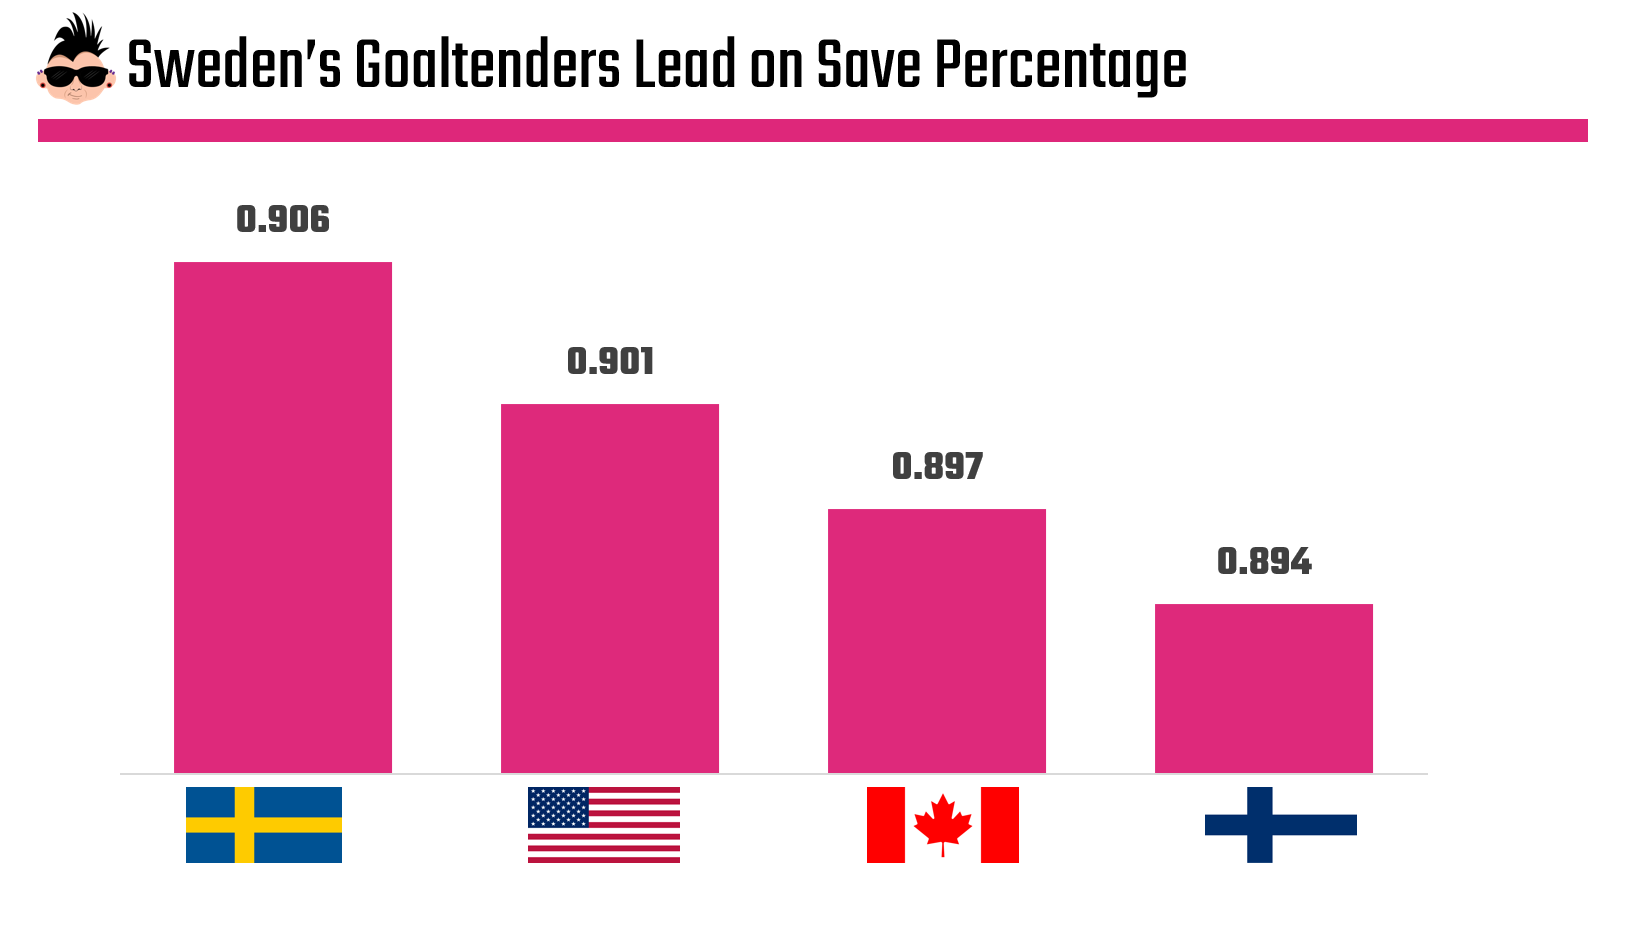
Now, the margin isn't massive, but this is typical at the NHL level with goalies as good as those in these lineups. That said, Sweden has the advantage here – and goaltending counts in big games.
Further, Swedish teams historically play a system that protects the middle of the ice. Fewer odd-man rushes, fewer chaotic scrambles. That structure allows goaltenders to be the difference.
Physicality
And finally, we also looked at a team's physicality. We created a custom metric to represent this, so similar to the Puck Possession metric you might find some variance in your own analyses. That notwithstanding, the results surprised us: Finland came out ahead. Yeah, who would have guessed?
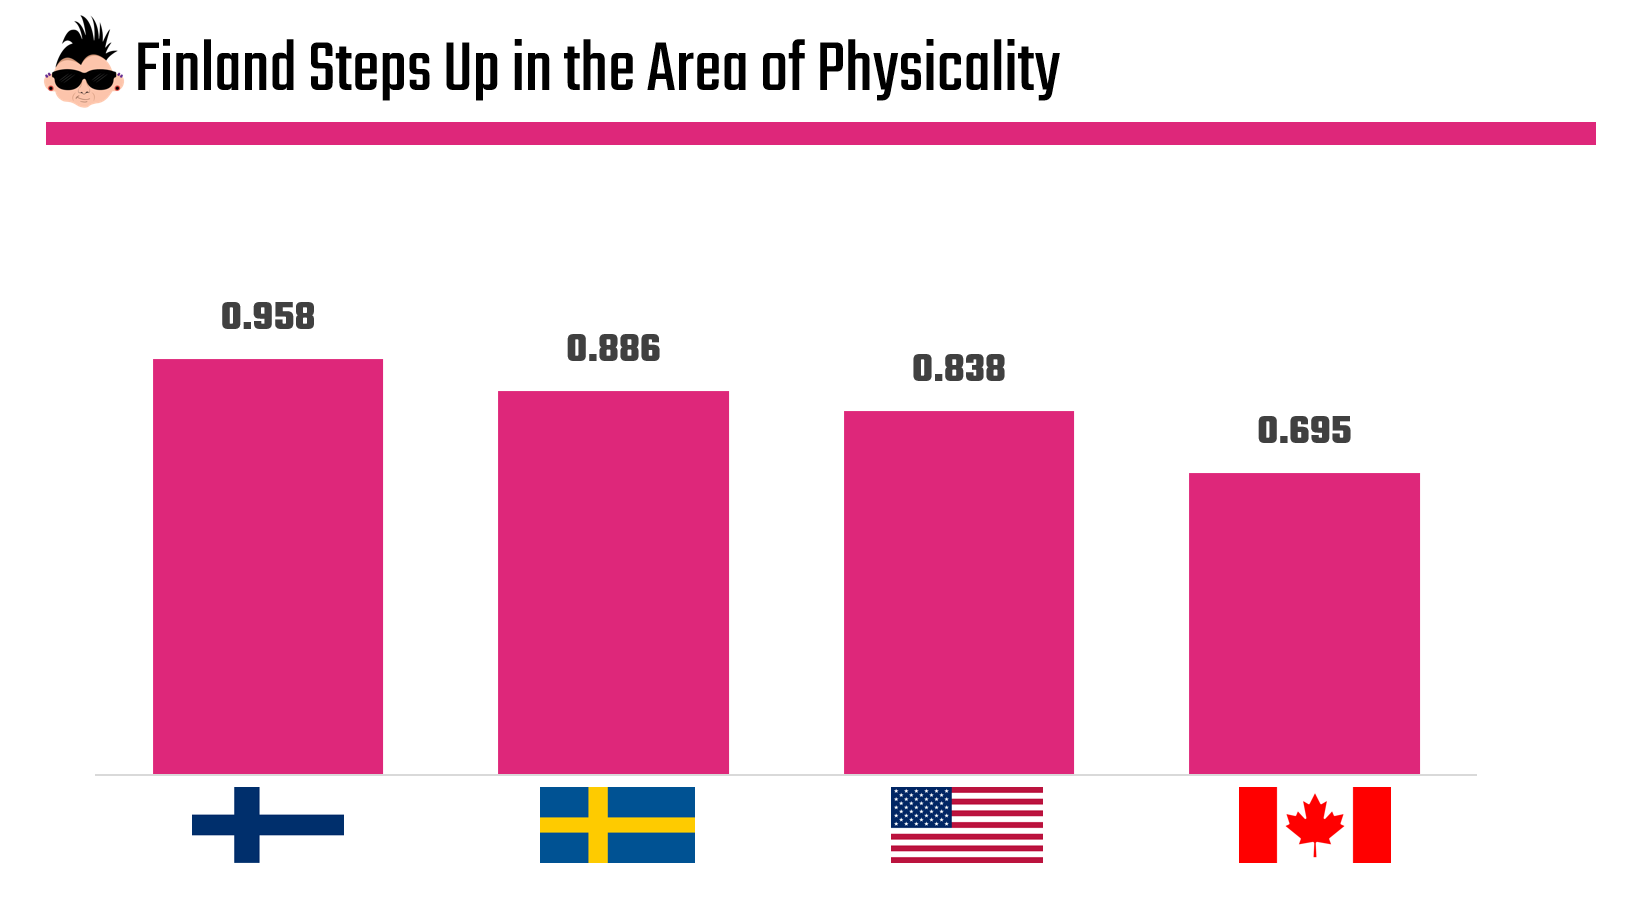
This leads us to believe that Finland is the most misunderstood of the four.
They don’t necessarily light up scoreboards. They don’t dominate possession charts. But dig into the physical metrics, and we see a different picture.
And this surprised us given how physical Team USA were last year. In fact, they branded themselves top pugilists when they came out swinging at the drop of the puck with Canada.
Be that as it may, perhaps Finland will be the agitator for the Olympics this year.
Want to conduct your own analysis? You can access the raw data here!
Who Wins Gold
If this were a best-of-seven series, the answer might change. Grit and goaltending can play more significant roles in the playoff grind.
But the Olympics aren’t about long-term regression. They’re about who can impose their identity fastest, with the least reliance on luck.
Let’s simplify the findings:
- Canada scores the most
- The U.S. controls shots and balance
- Sweden can steal games in net
- Finland drags you into a trench
Gold medals tend to reward offensive insulation; that is, teams that can survive one bad bounce, one soft goal, or one off night in net.
And that still points to Canada.
Not because they’re perfect, but because they’re resilient in the most valuable way. When systems break down and chaos creeps in, Canada has the talent to still convert. And this year's stats show them significantly out in front here.
The U.S. is close, very close. Their shot-based dominance suggests a breakout tournament is coming. But Olympic history is unkind to teams that need percentages to cooperate.
Sweden and Finland remain the most dangerous spoilers. Either could absolutely win gold if:
- Goaltending peaks at the right time (Sweden)
- Games tighten and emotions boil over (Finland)
But if pushed to opine on who would take the gold? We believe Canada sits on top. This is not because they’re a physical team, but because they’re the hardest to derail.
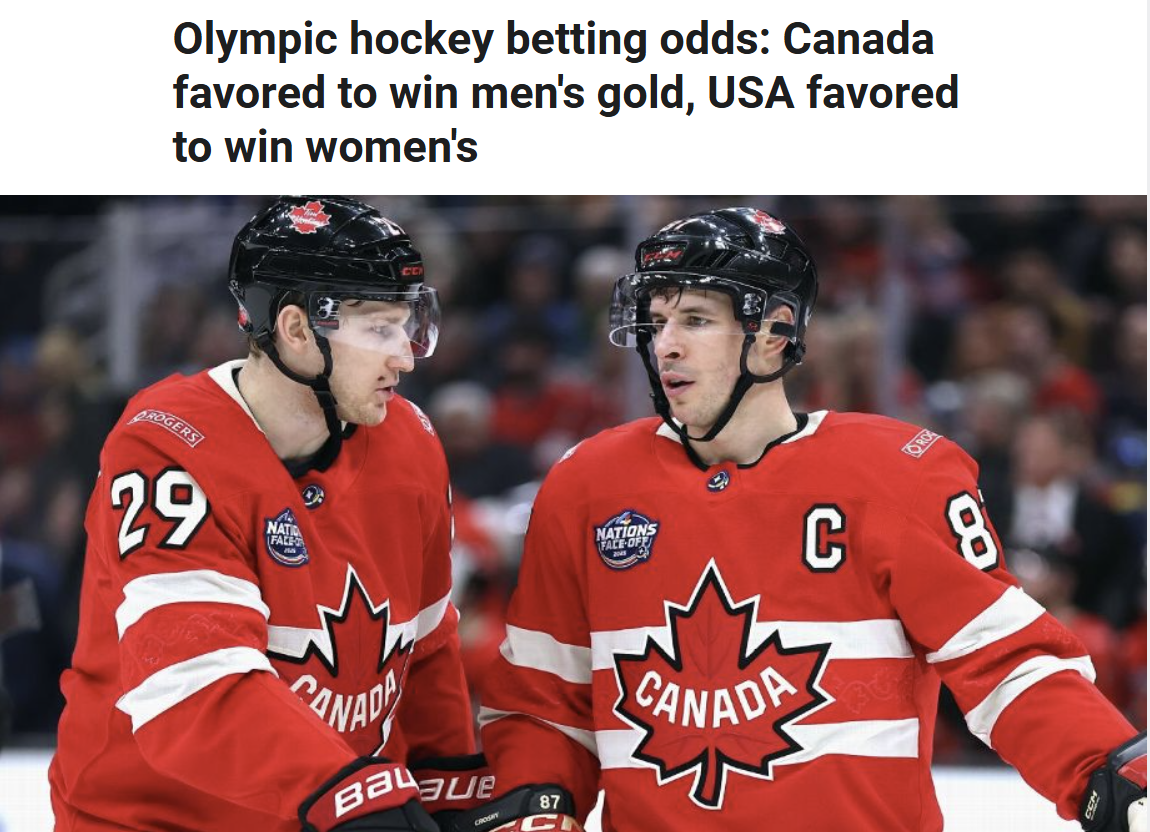
But don't just take our word for it; ESPN is holding this line as well.
Game on!
Subscribe to our newsletter to get the latest and greatest content on all things hockey analytics!
Member discussion