Module 2: Translating Hockey into Numbers

An Introductory Course in Hockey Analytics
At a Glance
- Visualizing the Scenario
- Offensive Zone Play and Stats
- Examples of Defensive Dynamics
- What about the Last Line of Defense: Goaltending?
Introduction
There are thousands of "events" that occur throughout a hockey game. Each event is captured as a raw statistic. The types of statistics that have been captured has evolved throughout the years. For example, in an earlier newsletter, we explored the team and player data from the full NHL hockey history (108 years), and in that article you can see several evolutionary steps for hockey statistics.
In your hockey analytics journey, you'll come across raw statistics, calculated statistics and advanced hockey metrics. When you get more advanced in your understanding and exposure to hockey statistics, you'll also see statistical metadata and anecdotes in, for example, game detail statistics – player name, position, and team are examples of metadata and notes are examples of anecdotes entered into record by the people recording the stats.
In this module, we'll present you with a simple scenario – one part of a hockey game. And we'll introduce you to some of the hockey statistics that are captured during that part of the game. The goal is not to have you understand all of the statistics captured; it's more for you to understand how and when these statistics are collected during a game.
Visualizing the Scenario
Imagine you're watching your favorite rivalry (Leafs versus the Habs anybody?) and the game is underway. Here's the scenario:
The centerman for the Leafs wins the face-off. He moves the puck back to the defenseman who passes to the right winger. The right winger skates with the puck and crosses the blue line into the offensive zone. He shoots on net, but the shot is blocked by one of the opposing defensemen from. The blocked shot ricochets to his left winger, who quickly snaps a shot into the net. This play results in a goal for the Leafs.
How would you diagram this sequence of events out? And how would it translate into a collection of statistics?
We've created a sequence of images to represent five steps where the puck was dropped to the point of the goal being scored.
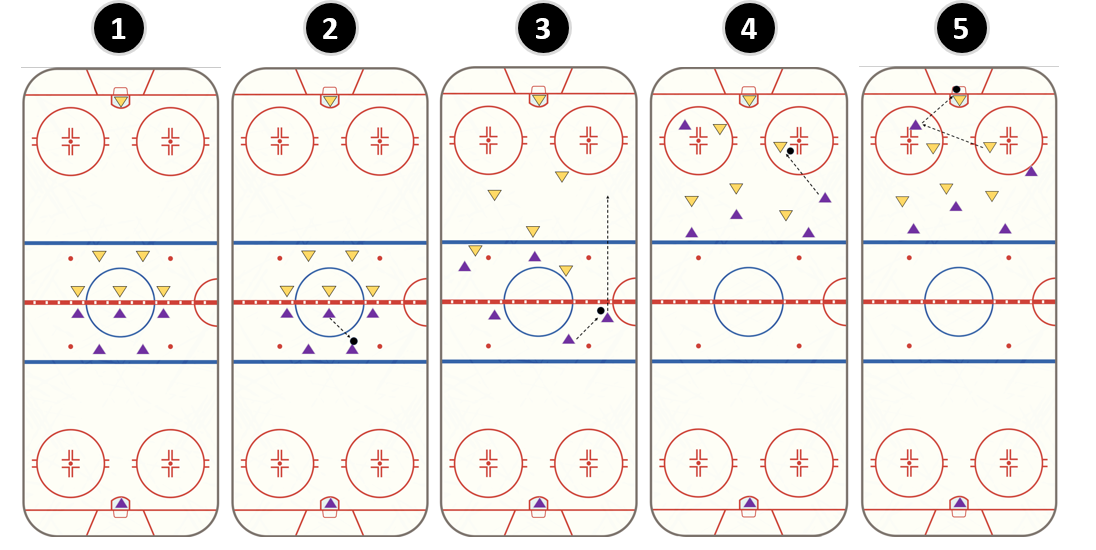
Let's explore each of the steps.
- Teams line up for the face off at center ice, and the puck is dropped.
- The Leafs' centerman wins the face off and moves the puck to their right defenseman.
- The right defenseman quickly moves the puck to the Leafs' right winger , who is breaking up the right wing.
- The right winger bursts into the offensive zone on the attack.
- The right winger takes a shot from the top of the circle; however, the Habs defenseman gets in-between the winger and the goalie and blocks the shot.
- The puck deflects to the Leafs' left winger who snaps the puck with a one-timer into the net.
From youth hockey to the pros, everybody is taught what to do off the face off. This would be a pretty common play; that is, to pull the puck back to the defenseman and either pass to the wing or take three strides and do a dump and rush. And in this scenario, the Leafs maintain possession of the puck for the entirety of the play, and it happens to go their way.
So, let's break down the play and the types of stats that are collected across offense, defense and goaltending.
Offensive Zone Play and Statistics
From an offensive perspective, in this play several statistics would be recorded. For example:
- The center would be credited with a face-off win, which contributes to his face-off win percentage.
- A pass would be recorded that occurred between the defenseman and right winger.
- The right winger's shot, despite being blocked, would count as a shot attempt, contributing to a Corsi statistic, a measure of the total shots directed at the net during even-strength play.
- The left winger who picked up the loose puck would be credited with 1) a shot on goal and 2) a goal.
- All players from the Leafs on the ice would see an increase in their plus/minus ratings, as a goal was scored during their shift.
When recorded, a statistic would likely have the following information associated with it, for example:
- Date, Venue, City
- Game ID
- Team, Home/Away
- Period, Shift Number
- Player Name, Position, Jersey Number
- Event Name (e.g., Shot on Goal)
- X, Y Position
Depending on the league, you'll see more or less hockey statistics, metadata and anecdotes collected – so richer statistics. The NHL, for example, and many data providers have game logs that give you lots of detail.
Examples of Defensive Dynamics
Let's switch gears and focus on the defensive team for a beat.
The moment the puck enters their defensive zone, their primary objective becomes to prevent a scoring opportunity from the team on offense. This involves blocking shots, disrupting passing lanes, and ultimately, getting the puck out of their zone. Standard operating procedures for defense is to force the incoming forwards to the boards, where they can tie up the forwards physically and have a higher chance of controlling the puck – and breaking it back out for a turnaround.
However, in this scenario the right-winger got a shot off before the defenseman had a chance to force him to the outside. So, here are the defensive stats that would be collected.
- The defenseman is credited with a blocked shot by virtue of blocking the shot attempt.
- All players from the Habs on the ice would see a decrease in their plus/minus ratings, as a goal was scored against them during their shift.
If the defenseman from defending team steals the puck from the right winger, this would count as a takeaway in the stat sheet. And if he passes to a forward who successfully clears the puck out of the defensive zone and into the neutral zone, this would translate into a pass.
The Last Line of Defense: Goaltending
Let's lastly focus on the goaltender in this scenario, which is pretty simple. He would be assessed a goal against for that play. This would count towards his broader goals against average (GAA) and save percentage. These are typically the two most important hockey statistics for a goalie, but there are other interesting indicators that you might evaluate as well, such as goalie starts and time on ice.
More generally, the goalie, the last line of defense, has a unique set of statistics. Suppose in our game, the goalie for the Habs faces 30 shots and allows 2 goals. His save percentage, a key statistic for goaltenders, would be calculated as the number of saves divided by the number of shots on goal. In this case, he made 28 saves on 30 shots, so his save percentage would be 28/30 = 0.933 or 93.3%.
If the game ended with a score of 2-1 in favor of the Leafs, the goalie's GAA would be calculated based on the total number of goals allowed (2) over the length of the game (usually 60 minutes in regulation time). It represents the average number of goals the goalie would allow if he played a full 60-minute game.
Moreover, if the goalie made a particularly impressive series of saves during a penalty kill, those saves would also count towards his penalty kill save percentage, a subset of his overall save percentage that specifically focuses on how well the goalie performs when his team is down a player.
Module 2 Summary
While the above can happen in hockey, scoring goals in a few seconds is rare. But let's, for argument sake, say that all of the above happened within five seconds of the puck being dropped. You begin to see just how many stats can be collected in a very short period of time during a hockey game.
A game is made up of three periods, twenty minutes per period, so a full sixty minutes of hockey. This assumes the game doesn't go into extra time (e.g., overtime or a shootout). During this time, thousands of events like the ones above are recorded.
Sign up to get free access to more weekly content and courseware on all things Hockey Analytics.
Member discussion