What Makes a Winning Playoff Team?

In this Edition
- What Makes a Winning Playoff Team?
- Statistical Markers to Predict Success
- Team Comparisons for the 2023-2024 Playoffs
Introduction
Well, we've just started Round 2 of the 2023-2024 NHL Playoffs, and things are about to get tighter and the grind a hell of a lot harder. The one remaining game in Round 1 is the closing of the Dallas and Vegas game, which is tonight.
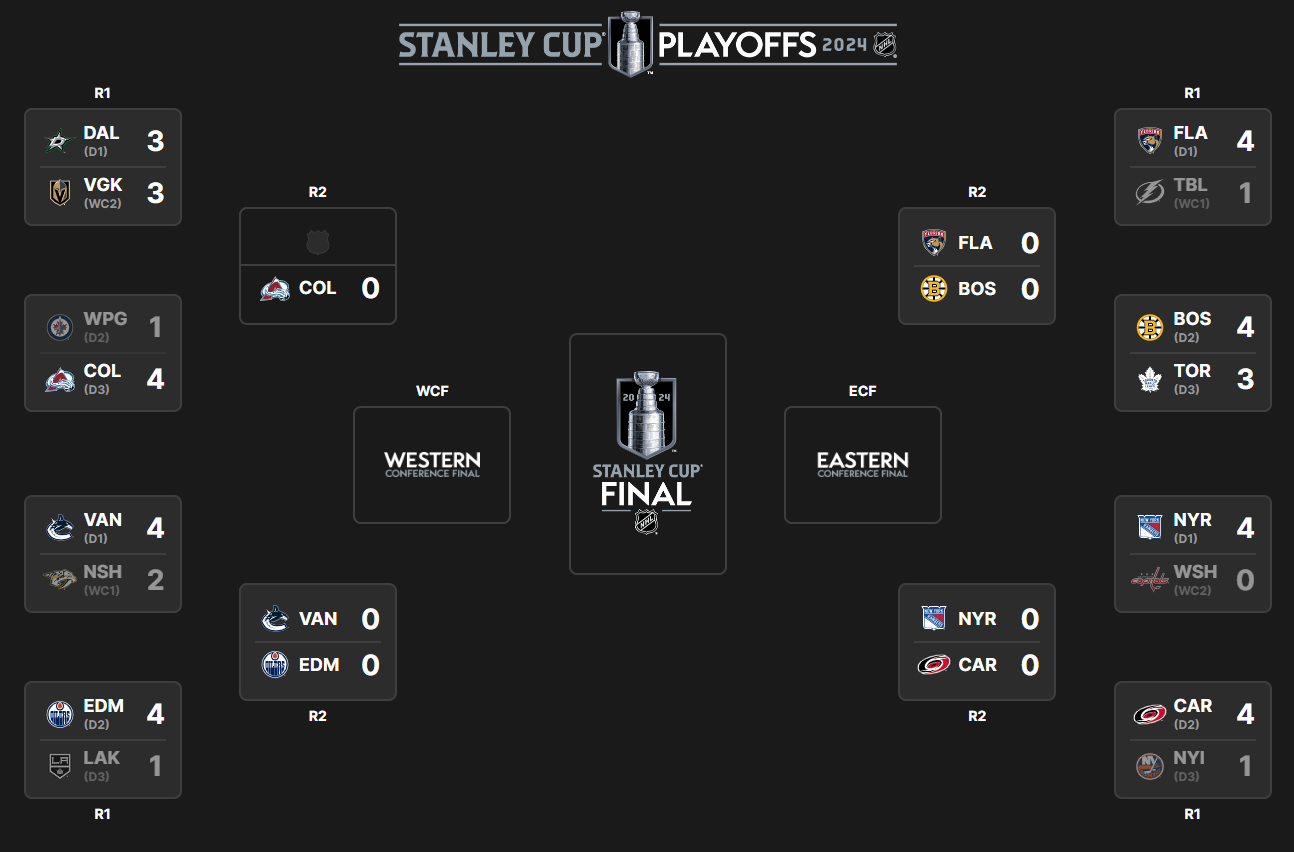
If you've been checking out our Playoff Reports page, you're liking see daily shifts across the reports we've created. For example, Connor McDavid continues to be a hockey stud – but more on the playmaking side, the stats show that teams are playing more defensively so far in the playoffs, and the Rangers continue to dominate in the Winning Percentage department.
So, given all the playoff excitement, we thought we'd continue our focus on the playoffs and discuss what makes a winning team and different ways you can measure it. We'll also put some of this into practice and compare two match-ups in Round 2 to see what the numbers say.
What Makes a Winning Team?
Rarely is there a single quality that itself substantiates a winning team. It's typically a combination of factors, largely skill and strategy with a dash of luck. It's also how those factors come together within a fast-paced game like hockey – where with the bounce of a puck a team's destiny can change.
We believe there are a few factors that separate the victors from the defeated, which we've listed below.
Depth and Balance
A deep and balanced roster is the cornerstone of playoff success. Teams with multiple lines capable of generating offense and shutting down opponents are formidable in the playoffs. This depth especially includes a reliable defensive corps and a goaltender who can steal games when needed. The ability to roll four lines confidently and seamlessly integrate depth players into crucial moments is a hallmark of playoff contenders.
Offense
The offense is where goals are scored. A strong and coordinated offense can break out effectively and move the puck up the ice and into the opponent's zone. They can cycle the puck along the boards, maintain puck possession and set up shots all across the offensive zone.
Defense
While offense may win games, defense wins championships. A robust defensive system, anchored by disciplined positioning, shot-blocking prowess, and reliable goaltending, is non-negotiable in the playoffs. Teams that limit high-danger scoring chances, excel in penalty killing situations, and maintain composure under pressure have a significant advantage.
Clutch Performances
The postseason is the stage for heroes to emerge. Whether it's a timely goal, a game-saving block, or a momentum-shifting save, playoff success often hinges on clutch performances. Players who thrive under pressure and elevate their game when it matters most become invaluable assets during deep playoff runs.
Special Teams
Penalties can mean the difference between a team winning or losing a game, series or the Cup. And special teams is where you're either shorthanded and defending or on the power play and on the offense. A potent power play and a reliable penalty kill can be the difference between advancing and going home early. Teams that capitalize on their man-advantage opportunities while neutralizing opponents' power plays gain a significant edge.
Coaching
Behind every successful playoff team is a tactician who can read the ebb and flow of games, make timely adjustments, and inspire confidence in their players. Coaches who can adapt strategies based on opponents' strengths and weaknesses, manage line matchups effectively, and instill a winning mentality are instrumental in playoff success.
Leadership
Veteran leadership and playoff experience are invaluable intangibles. Players who have been through the playoff grind understand the nuances of high-stakes hockey, provide steadiness in turbulent times, and lead by example both on and off the ice. Their presence in the locker room and on the bench can galvanize a team during crucial moments.
Health
The playoff journey is physically and mentally demanding. Staying healthy and resilient throughout the grueling postseason schedule is a formidable challenge. Teams with depth to withstand injuries, a sports medicine staff that optimizes recovery, and players who can push through adversity with unwavering determination gain a competitive advantage.
Emotional Intelligence
Controlling emotions is paramount in the pressure cooker of playoff hockey. Teams that can channel their intensity effectively, avoid costly penalties born out of frustration, and stay composed during momentum swings are better equipped to navigate the emotional rollercoaster of playoff hockey.
Home Ice Advantage
While the playoffs level the playing field to some extent, home ice advantage remains a factor. The energy of a supportive home crowd, familiar surroundings, and the comfort of last change can influence outcomes, especially in tightly contested series.
Luck
Finally, a dose of luck and favorable bounces often play a role in playoff success. Whether it's a fortuitous deflection, a timely goalpost save, or a puck that finds its way through a maze of bodies, serendipity can sway the outcome of critical games.
In sum, a winning playoff hockey team is a combination of skill, strategy, resilience, and luck. It combines depth and balance with a strong defensive foundation, thrives on clutch performances and special teams excellence, and is guided by astute coaching and seasoned leadership. Factor in health, emotional intelligence, home ice advantage, and a sprinkle of luck, and you have the blueprint for hoisting the Stanley Cup amidst the playoff pandemonium.
Statistical Markers to Predict Success
If you're a hockey data nerd, then you're likely familiar with the many raw and calculated statistics that you can use to evaluate a team's performance. You can also create composite metrics of your own to create more specialized ways to measure a player, team or game.
Measuring the elements that contribute to a winning playoff hockey team involves a combination of raw and calculated statistics (as well as qualitative and contextual analyses). In the table below, we took the factors that we noted above and listed out potential ways to measure them.
| Area | Example Metrics |
|---|---|
| Depth & Balance | Age, Playoff Experience, Plus/Minus, Line Production |
| Defense | Shots Against, Penalty Kill, Blocked Shots |
| Offense | Goals For, Shots For, Faceoff Percent |
| Goaltending | GAA, Save Percentage, Quality Starts |
| Clutch Performance | Game-winning Goals, OT Goals, Plus/Minus in 3rd Period/OT |
| Special Teams | PP Percent, PK Percent, SH Goals For/Against |
| Coaching | Coaching Experience, Lineup Matchups, Defensive Pairings |
| Leadership | Age, Playoff Experience, Leadership Production |
| Health | Injuries, Recovery Time, Production Impact of Injuries |
| Emotional Intelligence | Penalty Minutes, Major Penalties, Unforced Errors/Penalties |
| Home Ice | Wins at Home vs. Away, Special Teams at Home vs. Away |
If you were to build a set of reports that included all of the above, you would have a comprehensive view of a team's performance. You could also create team comparison views that would be multi-dimensional and give you a better and more discrete way to evaluate where a team may or may not perform well. Further, you could create composite metrics across each of the areas to reduce the number of metrics you're using.
Team Comparisons for the 2023-2024 Playoffs
In this section, we'll compare two Round 2 series through the lens of five different statistics:
- Save Percentage (SV PCT)
- Goals Against Average (GAA)
- Faceoff Percentage (FO PCT)
- Power Play Percentage (PP PCT)
- Penalty Kill Percentage (PK PCT)
For this analysis, we'll review the following two Round 2 series:
- New York Rangers vs Carolina Hurricanes
- Boston Bruins vs Florida Panthers
For this analysis, we'll start at a high level by analyzing the Win/Loss Percentage for the past four years for all teams. The goal was to see what the trend is for each team across their previous playoff appearances. Key to the chart is the Trend in the final cell of each row, where you can see a sparkline representing the four-year Win/Loss Percentage trend.
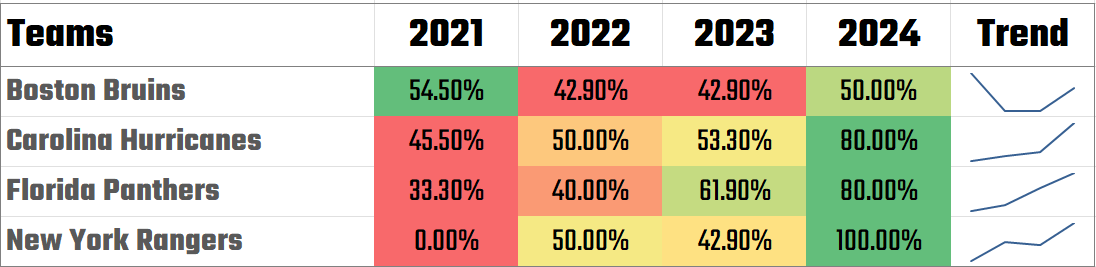
A few callouts from this Win/Loss Percentage chart:
- Most teams are showing an incrementally positive trend for their Win/Loss Percentage across the playoffs.
- Carolina and Florida are showing a smoother incremental shift with each season out of the four teams.
- Boston is not showing the same incremental growth; rather, they are showing a decline and had to fight hard to get past Toronto.
- New York is the anomaly, where they weren't in the 2021 playoffs and have been up and down to get to 2024. But, they are looking strong in the 2024 playoffs thus far.
While this tells us something directionally, let's evaluate each series against the five metrics we mentioned earlier.
New York vs. Carolina Hurricanes
In this next table, we use the five metrics to compare the performance across aspects of goaltending, offense and special teams. We captured two years worth of stats across the 2023 and 2024 seasons and created a table to compare the metrics.
Using this visualization, you can see the difference for each team between last season and this season. For example, in 2023, most statistics for New York and Carolina were close, save for goaltending – Carolina had a worse Save Percentage and GAA. For this season's playoffs, though, New York is out in front for all metrics save for Power Play Percentage.
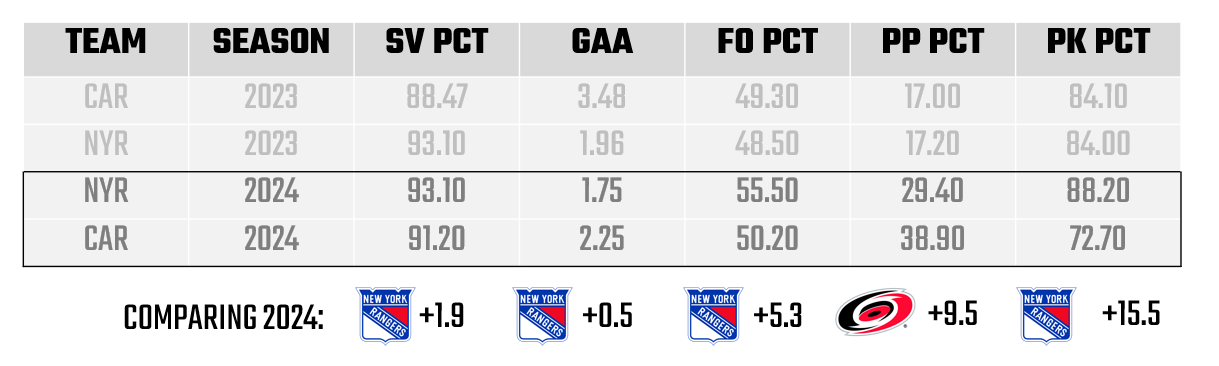
So, can we draw any conclusions from the above? Perhaps the following:
- New York's goaltending is stronger, and in the playoffs goaltending is of paramount importance.
- New York has the advantage on the faceoffs as well. A 5% difference on Faceoff Percentage is a sizeable gap, so Carolina will need to close this down.
- Carolina are stronger on the power play by a significant amount, so New York needs to stay out of the box.
- And conversely, New York are strong on the penalty kill.
Before we close with Carolina and the Rangers, let's expand the view to include other stats and only focus on the first round's worth of stats.

We can draw a couple of other conclusions using this expanded set of data. That is:
- We can see that Carolina landed significantly more shots on goal than New York.
- New York's defense is blocking more shots and coupled with their strong goaltending will be a big challenge for Carolina.
- New York is more physical (and chippy) when it comes to doling out hits.
So, on balance the series between Carolina and New York may come down to the following:
- For Carolina to win, they need to up-level their faceoffs, stay out of the box while continuing to capitalize on any Rangers' penalties, break the defensive wall and convert on their shots.
- For New York to win, they need to maintain the edge on the faceoffs, maintain the strength of their defense and goaltending, take no stupid penalties, and increase their shots on goal.
Both teams have had a few days rest and are good, solid teams. So, we think this will be a close series, will go the distance and be a fun one to watch.
Florida Panthers vs. Boston Bruins
In dramatic fashion, the Bruins managed to eliminate the Maple Leafs last night. They'll now face the Florida Panthers in Round 2, so we created a similar table with the same five metrics we used for the Rangers and Hurricanes.
Using this visualization, you can see the stats bias Boston. For example, in 2023, goaltending was fairly even, Boston dominated on the faceoffs and were way out ahead on special teams. In Round 1 of this year's playoffs, you can see that Boston is ahead on goaltending, Florida has improved their faceoffs, and Boston is still out ahead on special teams.
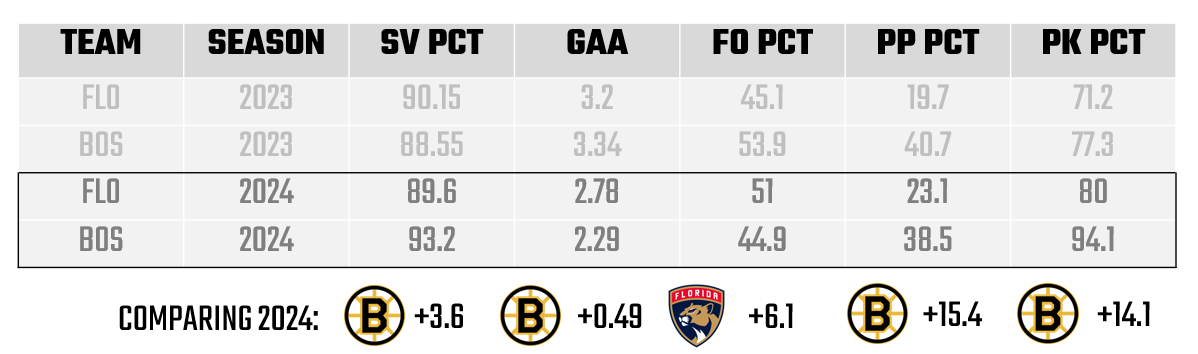
So, again, can we draw any conclusions from the above? Perhaps the following:
- The delta is significant across all stats, favoring Boston, save for Faceoff Percentage.
- Boston's goaltending is stronger, which is always a factor in the playoffs.
- Faceoffs alone won't win a series, and remember these stats are singly Round 1 (which is also reflective of a strong opponent in Toronto).
If we expand the view, you can see a couple of other interesting stats. For example, Florida is a more physical team. They get more penalties and give (and take) more hits. Florida also landed more shots on goal and are a strong team around the net.

So, again, on balance the series between Boston and Florida may come down to the following:
- For Florida to win, they need to up-level their faceoffs, stay out of the box, capitalize on any Bruins' penalties, maintain a strong offense and convert on their shots.
- For Boston to win, they need to maintain the edge on the faceoffs, maintain the strength of their defense and goaltending, be more physical (in a smart way), take no stupid penalties, and increase their shots on goal.
We anticipate a physical series that will likely go the distance. It will be close, but another fun one to watch.
Summary
In this edition, we discussed different factors that make up a winning team. We also mapped specific statistics (raw and calculated) to these factors so you can create a 360 degree view of a team using these different factors and stats.
We also mentioned creating composite metrics, but take care to test and experiment with composite metrics, such that you don't dilute or misrepresent what you're trying to measure.
We then took a subset of the metrics and analyzed two upcoming series, Carolina versus New York and Boston versus Florida. We sourced the data for the analyses from Hockey-Reference and from our own data provider (My Sports Feeds), and then used Excel to create different views we shared here.
We'd encourage you to build your own multi-dimensional views of teams, so you can get a better view of where a team is strong and weak. This gets especially useful when you build a comparative dashboard in Power BI.
Subscribe to our newsletter to get the latest and greatest content on all things hockey analytics!
Member discussion