4 Nations Face-Off: Can Sweden Beat the Odds?
At a Glance
- Overview of the 4 Nations Face-Off Series
A multi-part series covering the 4 Nations Face-Off tournament - What was our Latest Prediction?
We revisit our prediction from last week - Deep Dive on Team Sweden
Explores team recruitment, composition and offence, goaltending and experience - This Week's Prediction
Updates our prediction based on new findings and analyses from this week
Overview of the 4 Nations Face-Off Series
We kicked off our coverage of the 4 Nations Face-Off tournament last week with our newsletter entitled 4 Nations Face-Off: Finland is the Sleeper Team. If you didn't read it and want a quick catch-up, check out the below video.
The below are the newsletters we've published to date for this series:
The goal of this series is to explore each of the national teams that are participating in the tournament, so we can predict who will win the tournament. To do this, we're analyzing a snapshot of player data from the 2024-2025 season through the following context:
- Where the teams are recruiting their players from;
- A deep dive on each nation's team to understand strengths and weaknesses; and
- A comparative analysis of the teams to create a predictive model to forecast who will win the tournament.
In this week's edition, we'll focus on Team Sweden.
What was our Last Prediction?
Our first prediction was Canada in first, the USA in second, Sweden in third and Finland in fourth. However, two findings shifted our thinking in our last newsletter.
- We created a calculated metric (Overall Predictive Score) made up of offensive, goaltending and physicality statistics, which re-ranked the teams as per the below.
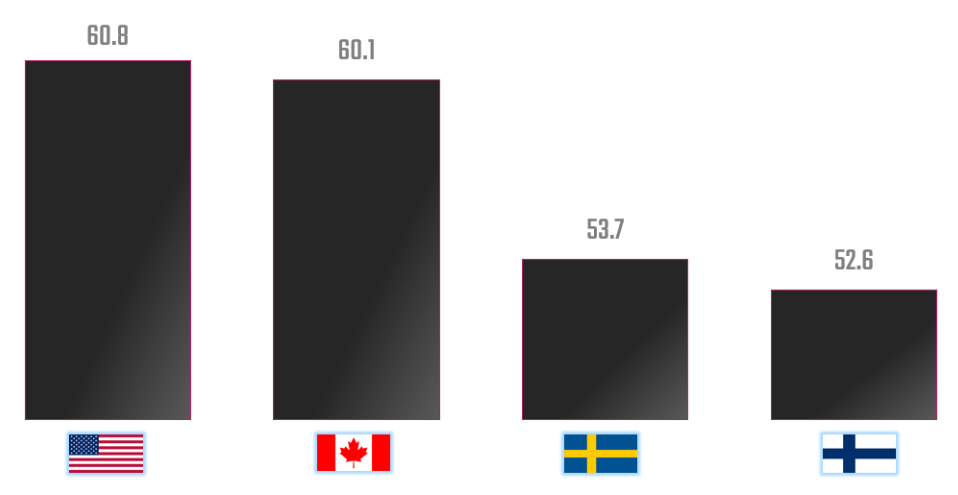
Further, you don't just get a ranking, but two groupings of teams emerged: one between the USA and Canada and the other between Sweden and Finland.
- We also did our first team deep dive on Finland, which led us to believe they were the tournament's sleeper team. This was primarily because 1) they have a strong, balanced forward line (across age and experience), 2) there is good playmaking cutting across forwards and defensemen, 3) they've recruited more heavily across a smaller number of teams (with 4 players coming from Florida), and 4) the expectations are low, so they can come in under the radar.
This shifted our prediction as of last week to be the USA in first, Canada in second, Finland in third (as the sleeper team) and Sweden in fourth.
We're going to test this new prediction this week with a deep dive on Sweden.
Deep Dive on Team Sweden
As we pulled the curtains back on the data, here's what we discovered about Sweden.
- They have a less concentrated recruitment strategy when compared to Finland.
- They have one of the statistically strongest goalies in Filip Gustavsson, but are spread thinner with their other goalies.
- They have a small core of young, point-producing players, for example, Adrian Kempe, Jesper Bratt and Lucas Raymond, and at the same time have more experienced players that are below the average team points, for example, Gustav Nyquist, Viktor Arvidsson, and William Karlsson.
- They have a strong defensive line.
- They are the least physical team of all the four nations.
So, what does all this mean?
We believe the data will hold for the games against Canada and the USA, so they will likely prevail over Sweden. However, the game between Finland and Sweden will be closer. But, given we positioned Finland as the sleeper team in our last newsletter, we believe that this means Sweden faces an uphill battle against Finland and in the tournament.
Let's dive into the data to explore this more.
Player Recruitment
In our last newsletter, we covered how each team has a slightly different sourcing strategy. Sweden and Finland are somewhat constrained by virtue of lower national representation in the league, but the USA and Canada are less constrained. The below gives you more data in the pool of players from which each nation is recruiting.
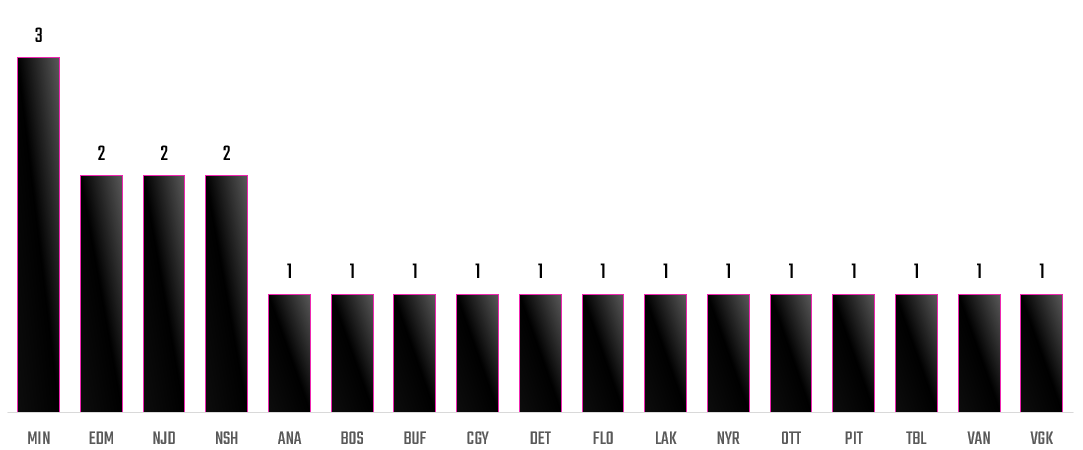
That said, Sweden are more heavily reliant on Edmonton, Minnesota, New Jersey, and Nashville. As you can see from the below, the aforementioned four teams are where Sweden is drawing their talent from, with a broader spread across 13 other teams. This is what we mean by a "less concentrated" recruitment strategy, which could lead to lower player cohesion on the ice.
Out of the players they have recruited, they do have a decent distribution of point production. For example, the below shows a snapshot of total points for all skaters, and the average points for Sweden is higher than that of Finland, their closest rival.
Team Sweden Power BI Dashboard
To help with our deep dive on Team Sweden, we built a Power BI dashboard. The dashboard comprises three reports:
- Offense – represented through Point Production
- Goaltending – showing GAA and Save Percentage
- Experience & Point Production – showing the relationship between Age and Points
Offense
In the first report, we have two Slicer controls and two Line and stacked column charts. The Slicer controls filter specific positions and players. The Line and stacked column charts visualize Points for specific players, along with Goals and Assists. The second chart shows Age versus Points.
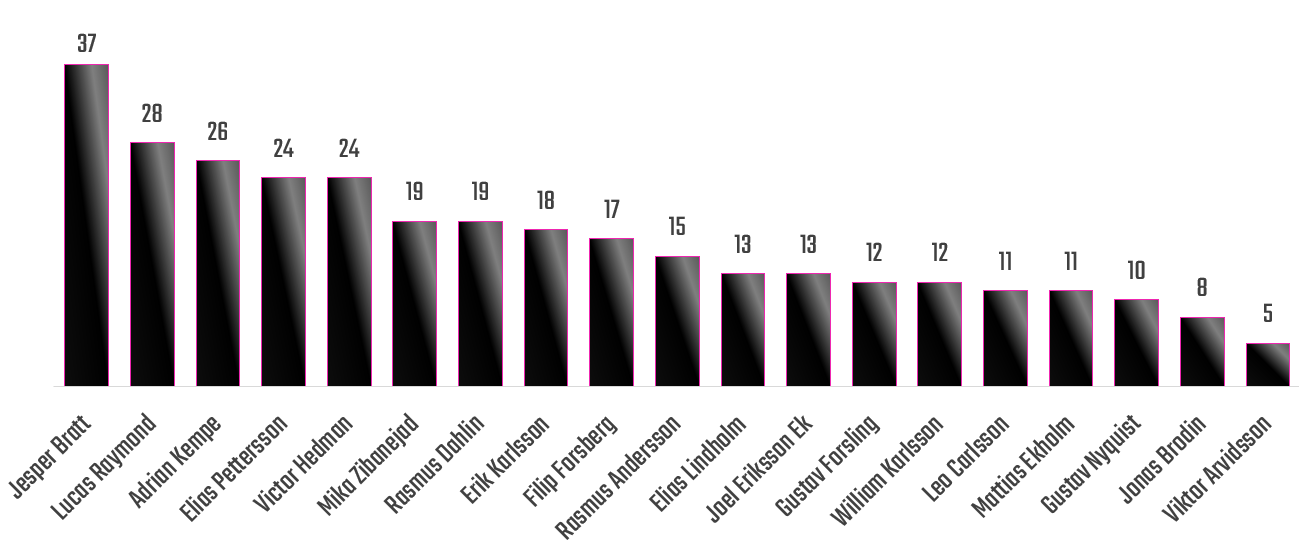
From the Point Production (Goals & Assists) chart, you can see the balance across the players. That is, you have a small cohort of point-producing players (Adrian Kempe, Jesper Bratt, Lucas Raymond and Elias Pettersson) and then the statistics amortize in a relatively normal pattern across the team. You can also see some balance in the goal-scoring prowess and playmaking ability across these players and in more experienced players like Mika Zbanejad. This balance across all players stands in contrast to the "two classes" of players we saw in Finland's statistics in our last newsletter.
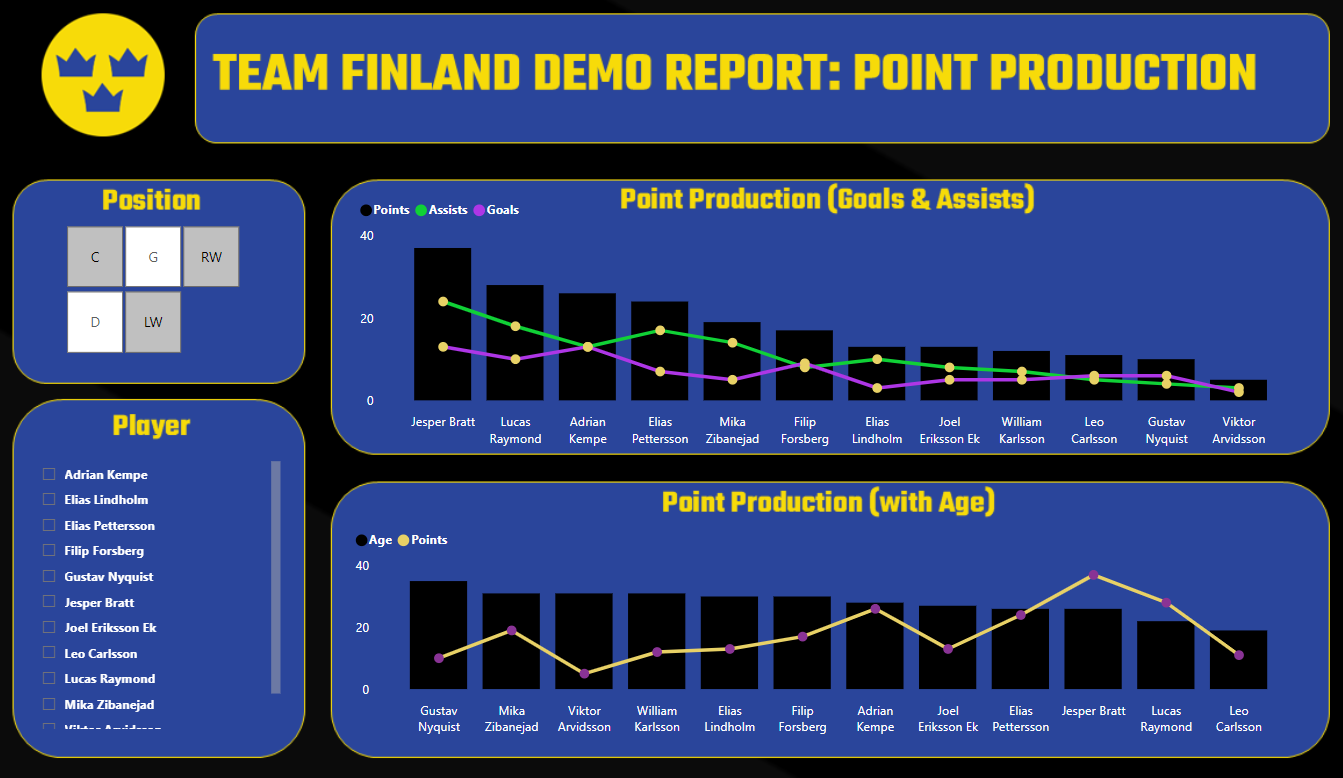
The Age versus Point Production tells a slightly different story. The above report is sorted by Age, and you see higher points towards the right-hand side of the column chart – indicating point production is higher among the younger players. Perhaps the strategy here is decidedly more experienced players leading the way for younger players to convert on goals.
Goaltending
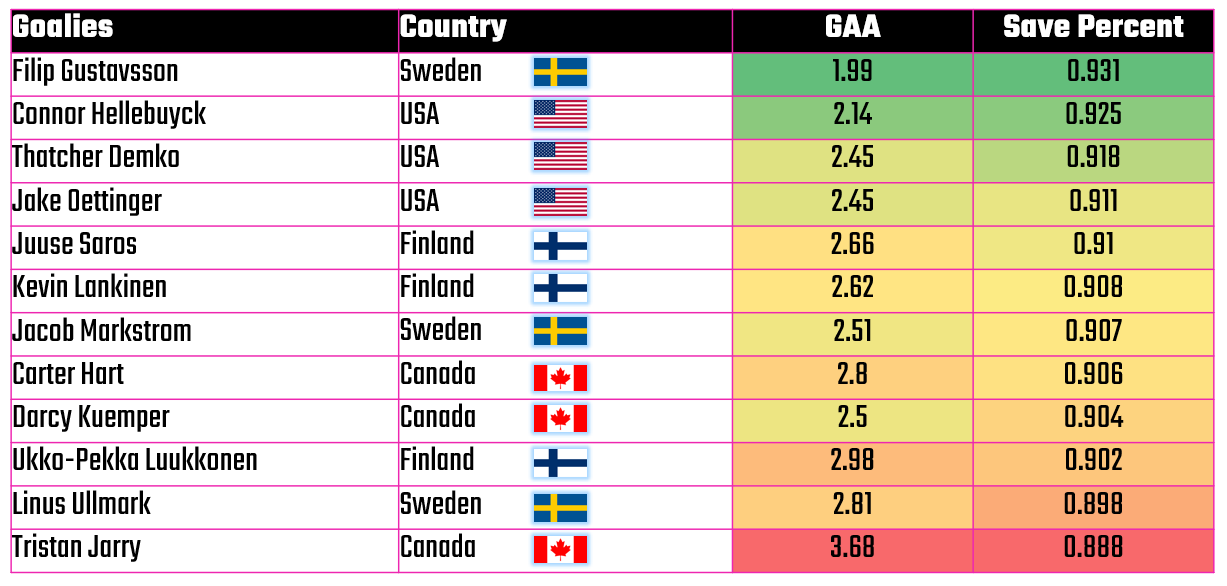
The second report includes a Slicer control and two Line and stacked column charts. The Slicer filters goalies, and the two charts measure Age versus GAA and Age versus Save Percentage. It's important to note that Filip Gustavsson is ranked the highest overall in the nations (at least when we pulled our data). However, Sweden's other goalies are in the middle of the pack and towards the bottom.
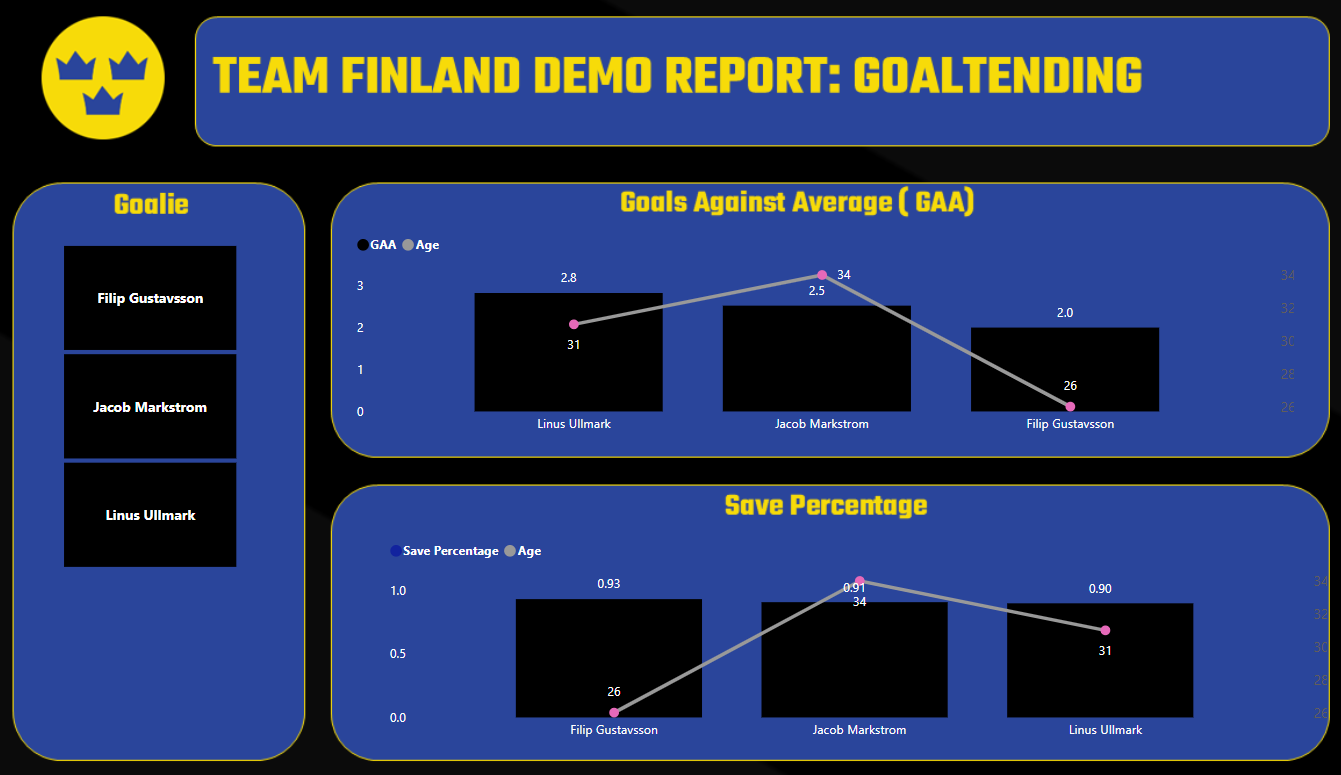
Here's a better view that shows a ranked view of the goalies (sorted on Save Percent). Now, we're not talking about the playoffs; this is a short, three-game round robin tournament with a potential fourth game if Sweden go the distance. However, if Gustavsson gets injured, then goaltending could be a factor.
Experience
And lastly, we wanted to see who was above the Average Points line (which was 17 at the time of our data pull). Ideally, you don't have too many players clustered towards the bottom right (older players with lower point production); you want balance across experience and production. Further, you don't want the trendline to be too steep from left to right – this indicates a more dramatic decline in production with more experienced players. With Sweden, we're seeing both of these issues: 1) a greater number of experienced players on or below the average and 2) a steeper, negative correlation between Age and Points.
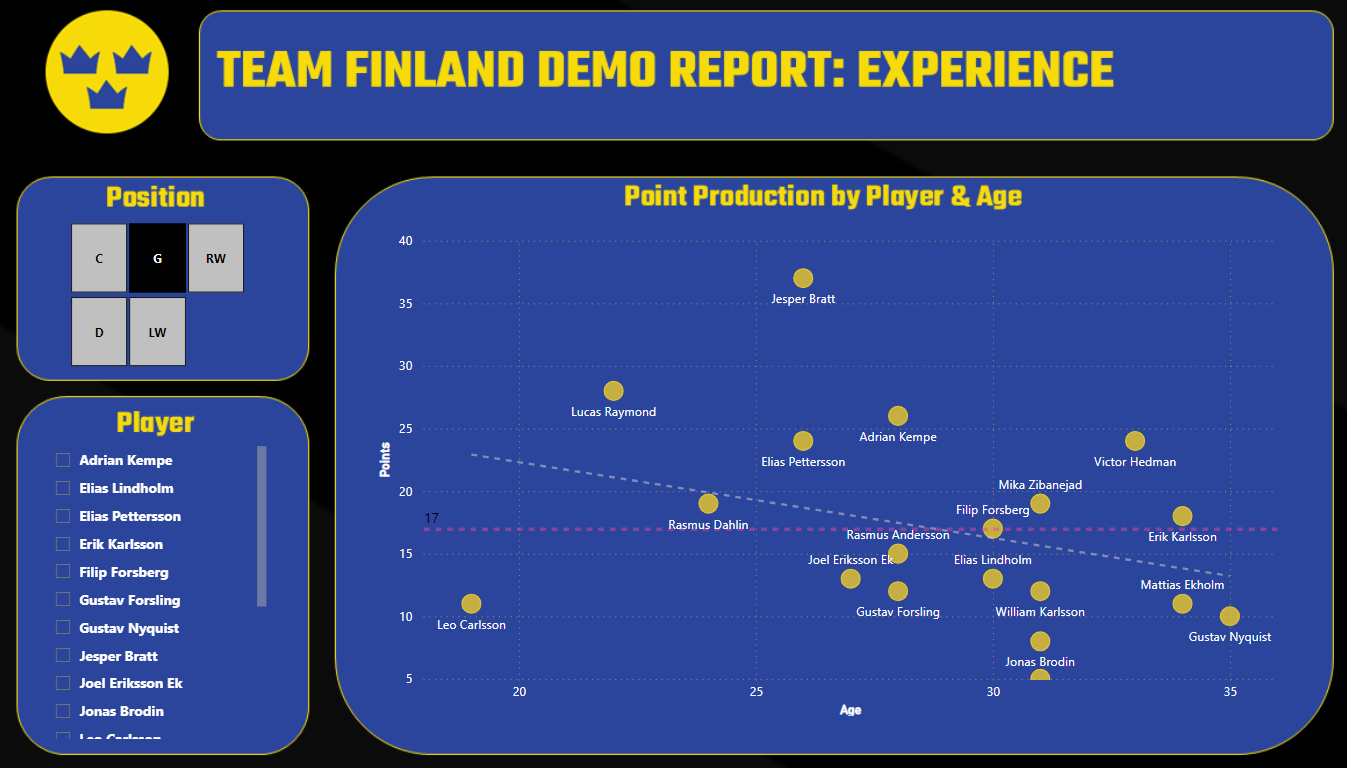
On a positive note, the above chart reinforces a cohort of younger, point-producing players that are near the center of the scatter plot and above the average Points line.
In summary, this reads like the more experienced guys are the playmakers for the young guns when it comes to Sweden.
This Week's Prediction
So, does any of the above shift our first week's prediction. Short answer: no. We still hold on the prediction from last week: 1) USA, 2) Canada, 3) Finland and 4) Sweden. Further, two rivalry matchups have emerged. The first is the Battle for North America, and the second is the Nordic Showdown. This will make the 4 Nations Face-Off even more fun to watch.
Further, what we've discovered this week is by looking at the data we have a deeper idea of how Sweden will compete in the tournament. That is, they seem to be employing a strategy of experienced players leading younger players to convert, relying on a strong goalie with a focus on a less physical game.
Whatever happens, this tournament is going to be fun to watch, and there's going to be an intense rivalry between Sweden and Finland.
Want more? Check out our quick-hit video on YouTube!
Summary
In this week's newsletter, we did a deep dive on Team Sweden. We looked at their recruitment strategy and then built another Power BI dashboard for Sweden that explores their offense, goaltending and experience.
You can download the Power BI dashboard here.
On the heels of exploring Finland, we now have a better idea of how Sweden will potentially approach the tournament. That is, we believe that the Swedes will employ a strong defensive line to support their experienced players setting up the young guns to convert. They'll try and hold the crease with one of the strongest goalies in the tournament, and they will be a less physical team.
Question is will this be enough?
Subscribe to our newsletter to get the latest and greatest content on all things hockey analytics!
Member discussion